Appendices A-C NAEP 2021 Supplemental Documents
Appendices A-C NAEP 2022 Committees, Weighting Procedures and Sampling Memo.docx
National Assessment of Educational Progress (NAEP) 2022
Appendices A-C NAEP 2021 Supplemental Documents
OMB: 1850-0928
NATIONAL CENTER FOR EDUCATION STATISTICS NATIONAL ASSESSMENT OF EDUCATIONAL PROGRESS
National Assessment of Educational Progress (NAEP) 2022
Appendix A-C
External Advisory Committees
OMB# 1850-0928 v.22

March 2021
Table of Contents
Appendix A- Committees and Panels 2
Appendix B- Weighting Procedures 13
The 2013 Weighting Procedures documentation is the most current version available to the public. At this time, there is not a timeline for when the details for later assessment years will be publicly available.
Appendix C- 2021 Sampling Memo 65
The 2022 Sampling Memo will be updated and submitted by August 2021
Appendix A
Appendix A-1: NAEP Design and Analysis Committee (DAC)
-
Name
Affiliation
Betsy Becker
Florida State University, FL
Peter Behuniak
Criterion Consulting, LLC, CT
Dan Bolt
University of Wisconsin, Madison, WI
Lloyd Bond
University of North Carolina, Greensboro, NC (Emeritus)/Carnegie Foundation (retired)
Derek Briggs
University of Colorado, Boulder, CO
Richard Duran
University of California, Santa Barbara, CA
Ben Hansen
University of Michigan, MI
Brian Junker
Carnegie Mellon University, PA
David Kaplan
University of Wisconsin-Madison, WI
Kenneth Koedinger
Carnegie Mellon University, PA
Sophia Rabe-Hesketh
University of California, Berkeley, CA
Michael Rodriguez
University of Minnesota, MN
S. Lynne Stokes
Southern Methodist University, TX
Chun Wang
University of Washington, WA
Appendix A-2: NAEP Validity Studies Panel (NVS)
-
Name
Affiliation
Keena Arbuthnot
Peter Behuniak
Office of Research and Economic Development
Louisiana State University, LA
Criterion Consulting, LLC, CT
Jack Buckley
Panel Chair American Institutes for Research, Washington, DC
Jim Chromy
RTI International (Emeritus Fellow), Raleigh, NC
Phil Daro
Strategic Education Research Partnership (SERP) Institute, Washington, DC
Richard Duran
Gevirtz Graduate School of Education University of California, Santa Barbara, CA
David Grissmer
Curry School of Education University of Virginia, VA
Larry Hedges
Institute for Policy Research Northwestern University, IL
Gerunda Hughes
Washington, DC
Ina Mullis
TIMSS & PIRLS International Study Ctr, Boston College, MA
Scott Norton
Deputy Executive Director, Programs Council of Chief State School Officers, Washington, DC
Jim Pellegrino
University of Illinois
atof Chicago/Learning Sciences Research Institute, ILGary Phillips
Cambium Assessment, Washington, DC
Lorrie Shepard
School of Education University of Colorado
atBoulder, CODavid Thissen
Dept. of Psychology University of North Carolina at Chapel Hill, NC
Gerald Tindal
University of Oregon, Eugene, OR
Sheila Valencia
Washington, WA
Denny Way
College Board. Washington, DC.
Appendix A-3: NAEP National Indian Education Study Technical Review Panel (NIES)
Name Affiliation
Mandy Smoker Broaddus Education Northwest, Portland, OR
Doreen E. Brown ASD Education Center, Anchorage, AK
Robert B. Cook Teach for America, Summerset, SD
Steve Andrew Culpepper University of Illinois at Urbana-Champaign, IL
Dr. Susan C. Faircloth Panel Chair, Colorado State University, Fort Collins, CO
Dr. Chris Gordon JKL Bahweting Anishinaabe PSA, Sault Ste. Marie, MI
Dr. Jameson D. Lopez University of Arizona. Tucson, AZ
Jeremy MacDonald Rocky Boy Elementary, Box, Elder, MT
Dr. Holly Jonel Mackey North Dakota State University, ND
Jeannette Muskett Miller Central Consolidated School District, Gallup, AZ
Debora Norris Arizona School Facilities Board, Phoenix, AZ
Sedelta Oosahwee National Education Association, DC
Dr. Martin Reinhardt Northern Michigan University, MI
Appendix A-4: NAEP Mathematics Standing Committee
-
Name
Affiliation
June Ahn
University of California, Irvine, CA
Scott Baldridge
Louisiana State University, Baton Rouge, LA
Joe Garofalo
University of Virginia, Charlottesville, VA
Mark Howell
Jennifer Langer-Osuna
Gonzaga College High School, Washington, DC
Stanford University, Stanford, CA
Michele Mailhot
Maine Department of Education, Augusta, ME
Kayonna Pitchford
University of North Carolina, Pembroke, NC
Angelica Niño
De Zavala Elementary School, San Antonio, TX
Allan Rossman
California Polytechnic State University, College of Mathematics and Science, San Luis Obispo, CA
Amy Roth McDuffie
Washington State University, Pullman, WA
Edward Silver
University of Michigan, Ann Arbor, MI
Lya Snell
Georgia Department of Education, Atlanta, GA
Zalman Usiskin
University of Chicago, Chicago, IL
Vivian Valencia
Eutimio “Tim” Salazar III Elementary, Española
Public Schools, Española, NM
Appendix A-5: NAEP Reading Standing Committee
-
Name
Affiliation
Patricia Alexander
University of Maryland, College Park, MD
Alison Bailey
Jensa Bushey
University of California, Los Angeles, CA
Shelburne Community Schools, Shelburne, VT
Bridget Dalton
Christy Howard
University of Colorado, Boulder, CO
East Carolina University, Greenville, NC
Jeanette Mancilla-Martinez
Vanderbilt University, Nashville, TN
Pamela Mason
Harvard Graduate School of Education, Cambridge, MA
Frank Serafini
Arizona State University, Phoenix, AZ
Kris Shaw
Ana Taboada Barber
Kansas State Department of Education, Topeka, KS
University of Maryland, College Park, MD
Diana Townsend
Brandon Wallace
University of Nevada, Reno, NV
Montgomery College, Takoma Park, MD
Appendix A-6: NAEP Survey Questionnaire Standing Committee
Name
Flávio Cunha |
Affiliation
Rice University, Houston, TX |
Hunter Gehlbach |
Johns Hopkins School of Education, Baltimore, MD
|
Cassandra Guarino |
University of California, Riverside, CA |
Jori Hall |
University of Georgia, Athens, GA |
Henry Levin
Laura Moore
|
Teachers College, Columbia University, NY, NY
Obama Foundation, Chicago, IL |
Stanley Presser |
University of Maryland, College Park, MD |
Leslie Rutkowski |
Indiana University Bloomington, IN |
Akane Zusho |
Fordham University, NY, NY
|
Appendix A-7: NAEP Mathematics Translation Review Committee
-
Name
Affiliation
Mayra Aviles
Puerto Rico Department of Education, Hato Rey, PR
David Feliciano
The Melrose School (P.S./M.S 29), Bronx, NY
Yvonne Fuentes
University of West Georgia, Carrollton, GA
Marco Martinez-Leandro
Sandia High School, Albuquerque, NM
Jose Antonio (Tony) Paulino
Nathan Straus Preparatory School (P.S. 140M), New York, NY
Evelisse Rosado Rivera
Puerto Rico Department of Education, Hato Rey, PR
Myrna Rosado-Rasmussen
Austin Independent School District, Austin, TX
Gloria Rosado Vazquez
Puerto Rico Department of Education, Hato Rey, PR
Enid Valle
Kalamazoo College, Kalamazoo, MI
Appendix A-8: NAEP Grade 4 and 8 Survey Questionnaires and eNAEP DBA System Translation Committee
-
Name
Affiliation
Daniel Berdugo
Wilton Elementary School (PS 30X), Bronx, NY
Yvonne Fuentes
University of West Georgia, Carrollton, GA
Marco Martinea-Leandro
Sandia High School, Albuquerque, NM
Jose Antonio (Tony) Paulino
Nathan Straus Preparatory School (P.S. 140M), New York, NY
Evelisse Rosado Rivera
Puerto Rico Department of Education, Hato Rey, PR
Myrna Rosado-Rasmussen
Austin Independent School District, Austin, TX
Gloria M. Rosado Vazquez
Puerto Rico Department of Education, Hato Rey, PR
Enid Valle
Kalamazoo College, Kalamazoo, MI
Appendix A-9: NAEP Principals’ Panel Standing Committee
-
Name
Affiliation
David Atherton
Clear Creek Middle School, Gresham, OR
Williams Carozza
Harold Martin Elementary School, Hopkinton, NH
Rita Graves
Pin Oak Middle School, Bellaire, TX
Stephen Jackson
Principal Consultant and Chair, NAEP Principals’ Panel
Anthony Lockhart
Fulton-Holland Educational Services Center
West Palm Beach, FL
Lillie McMillan
Kourtney Miller
Porter Elementary School, San Diego, CA
Chavez Prep Middle School, Washington, DC
Jason Mix
Howard Lake–Waverly–Winsted High School, Howard Lake, MN
Leon Oo-Sah-We
Ardith Bates Stanford
Saint Francis Indian School, Saint Francis, SD
Murray County Schools, Chattanooga, TN
Sylvia Rodriguez Vargas
The Hill School, Pottstown, PA
Appendix B
NATIONAL CENTER FOR EDUCATION STATISTICS NATIONAL ASSESSMENT OF EDUCATIONAL PROGRESS
National Assessment of Educational Progress (NAEP)
2021
Appendix B
NAEP 2013 Weighting Procedures
OMB# 1850-0928 v.22
March 2021
No changes since v.10
The 2013 Weighting Procedures documentation is the most current version available to the public. At this time, there is not a timeline for when the details for later assessment years will be publicly available.
NAEP Technical Documentation Website
NAEP Technical Documentation Weighting Procedures for the 2013 Assessment
NAEP assessments use complex sample designs to create student samples that generate population and subpopulation estimates with reasonably high precision. Student sampling weights ensure valid inferences from the student samples to their respective populations. In 2013, weights were developed for students sampled at grades 4, 8, and 12 for assessments in mathematics and reading.
Computation of Full-Sample Weights
Computation of Replicate Weights for Variance Estimation
Quality Control on Weighting Procedures
Each student was assigned a weight to be used for making inferences about students in the target population. This weight is known as the final full-sample student weight and contains the following major components:
 the
student base weight;
the
student base weight;

 school
nonresponse adjustments; student nonresponse adjustments; school
weight trimming adjustments;
school
nonresponse adjustments; student nonresponse adjustments; school
weight trimming adjustments;
student
weight trimming adjustments; and student raking adjustment.
The student base weight is the inverse of the overall probability of selecting a student and assigning that student to a particular assessment. The sample design that determines the base weights is discussed in the NAEP 2013 sample design section.
The student base weight is adjusted for two sources of nonparticipation: school level and student level. These weighting adjustments seek to reduce the potential for bias from such nonparticipation by
increasing
the weights of students from participating schools similar to those
schools not participating; and
increasing
the weights of participating students similar to those students from
within participating schools who did not attend the assessment
session (or makeup session) as scheduled.
Furthermore, the final weights reflect the trimming of extremely large weights at both the school and student level. These weighting adjustments seek to reduce variances of survey estimates.
An additional weighting adjustment was implemented in the state and Trial Urban District Assessment (TUDA) samples so that estimates for key student-level characteristics were in agreement across assessments in reading and mathematics. This adjustment was implemented using a raking procedure.
In addition to the final full-sample weight, a set of replicate weights was provided for each student. These replicate weights are used to calculate the variances of survey estimates using the jackknife repeated replication method. The methods used to derive these weights were aimed at reflecting the features of the sample design, so that when the jackknife variance estimation procedure is implemented, approximately unbiased estimates of sampling variance are obtained. In addition, the various weighting procedures were repeated on each set of replicate weights to appropriately reflect the impact of the weighting adjustments on the sampling variance of a survey estimate. A finite population correction (fpc) factor was incorporated into the replication scheme so that it could be reflected in the variance estimates for the reading and mathematics assessments. See Computation of Replicate Weights for Variance Estimation for details.
Quality control checks were carried out throughout the weighting process to ensure the accuracy of the full-sample and replicate weights. See Quality Control for Weighting Procedures for the various checks implemented and main findings of interest.
In the linked pages that follow, please note that Vocabulary, Reading Vocabulary, and Meaning Vocabulary refer to the same reporting scale and are interchangeable.
http://nces.ed.gov/nationsreportcard/tdw/weighting/2013/naep_assessment_weighting_procedures.aspx

NAEP Technical Documentation Computation of Full- Sample W eights for the 2013 Assessment
The full-sample or final student weight is the sampling weight used to derive NAEP student estimates of population and subpopulation characteristics for a specified grade (4, 8, or 12) and assessment subject (reading or mathematics). The full-sample student weight reflects the number of students that the sampled student represents in the population for purposes of estimation. The summation of the final student weights over a particular student group provides an estimate of the total number of students in that group within the population.
The full-sample weight, which is used to produce survey estimates, is
Computation of Base Weights
School and Student Nonresponse Weight Adjustments
School and Student Weight Trimming Adjustments
Student Weight Raking Adjustment
distinct from a replicate weight that is used to estimate variances of survey estimates. The full-sample weight is assigned to participating students and reflects the student base weight after the application of the various weighting adjustments. The full-sample weight for student k from school s in stratum j (FSTUWGTjsk) can be expressed as follows:
![]()
where
STU_BWTjsk
is the
student
base weight;
 SCH_NRAFjs
is the school-level nonresponse adjustment
factor; STU_NRAFjsk
is the student-level nonresponse adjustment
factor; SCH_TRIMjs
is the school-level weight trimming adjustment
factor; STU_TRIMjsk
is the student-level weight trimming adjustment
factor; and STU_RAKEjsk
is the student-level
raking adjustment factor.
SCH_NRAFjs
is the school-level nonresponse adjustment
factor; STU_NRAFjsk
is the student-level nonresponse adjustment
factor; SCH_TRIMjs
is the school-level weight trimming adjustment
factor; STU_TRIMjsk
is the student-level weight trimming adjustment
factor; and STU_RAKEjsk
is the student-level
raking adjustment factor.
School sampling strata for a given assessment vary by school type and grade. See the links below for descriptions of the school strata for the various assessments.
Public
schools at grades 4 and 8 Public schools at grade 12
Private
schools at grades 4, 8 and 12

NAEP Technical Documentation Computation of Base Weights for the 2013 Assessment
Every sampled school and student received a base weight equal to the reciprocal of its probability of selection. Computation of a school base weight varies by

 type
of sampled school (original or substitute); and sampling frame (new
school frame or not).
type
of sampled school (original or substitute); and sampling frame (new
school frame or not).
Computation of a student base weight reflects
School Base Weights Student Base Weights
the
student's overall probability of selection accounting for school and
student sampling; assignment to session type at the school- and
student-level; and
 the
student's assignment to the reading or mathematics assessment.
the
student's assignment to the reading or mathematics assessment.

NAEP Technical Documentation School Base Weights for the 2013 Assessment
The school base weight for a sampled school is equal to the inverse of its overall probability of selection. The overall selection probability of a sampled school differs by

 type
of sampled school (original or substitute); sampling frame (new
school frame or not).
type
of sampled school (original or substitute); sampling frame (new
school frame or not).
The overall selection probability of an originally selected school in a reading or mathematics sample is equal to its probability of selection from the NAEP public/private school frame.
The overall selection probability of a school from the new school frame in a reading or mathematics sample is the product of two quantities:
the
probability of selection of the school's district into the new-school
district sample, and the probability of selection of the school into
the new school sample.
Substitute schools are preassigned to original schools and take the place of original schools if they refuse to participate. For weighting purposes, they are treated as if they were the original schools that they replaced; so substitute schools are assigned the school base weight of the original schools.
Learn more about substitute schools for the 2013 private school national assessment and substitute schools for the 2013 twelfth grade public school assessment.

NAEP Technical Documentation Student Base Weights for the 2013 Assessment
Every sampled student received a student base weight, whether or not the student participated in the assessment. The student base weight is the reciprocal of the probability that the student was sampled to participate in the assessment for a specified subject. The student base weight for student k from school s in stratum j (STU_BWTjsk) is the product of seven weighting components and can be expressed as follows:
![]()
where
 SCH_BWTjs
is the school base weight;
SCH_BWTjs
is the school base weight;
 SCHSsessionassignmentESWTjs
is the school-level
session assignment weight
that reflects the conditional probability, given the school, that the
particular session type was assigned to the school;
SCHSsessionassignmentESWTjs
is the school-level
session assignment weight
that reflects the conditional probability, given the school, that the
particular session type was assigned to the school;
WINSCHWTjs
is the within-school
student weight
that reflects the conditional probability,
given the school, that the student was selected for the NAEP
assessment;
STUSESWTjsk
is Stu_bookmarkthe
student-level session
assignment weight that
reflects the conditional probability, given that the particular
session type was assigned to the school, that the student was
assigned to the session type;
SUBJFACsubjfacjsk
is the subject spiral adjustment factor that reflects
the conditional probability, given that the student was assigned to a
particular session type, that the student was assigned the specified
subject;
SUBADJjs
is the substitution adjustment factor to account for the
difference in enrollment size between the substitute and original
school; and
YRRND_AFjs
is the year-round
adjustment factor to account for students
in year- round schools on
scheduled break at the time of the NAEP assessment and thus not
available to be included in the sample.
The within-school student weight (WINSCHWTjs) is the inverse of the student sampling rate in the school.
The subject spiral adjustment factor (SUBJFACjsk) adjusts the student weight to account for the spiral pattern used in distributing reading or mathematics booklets to the students. The subject factor varies by grade, subject, and school type (public or private), and it is equal to the inverse of
the booklet proportions (reading or mathematics) in the overall spiral for a specific sample.
For cooperating substitutes of nonresponding original sampled schools, the substitution adjustment factor (SUBADJjs) is equal to the ratio of the estimated grade enrollment for the original sampled school to the estimated grade enrollment for the substitute school. The student sample from the substitute school then "represents" the set of grade-eligible students from the original sampled school.
The year-round adjustment factor (YRRND_AFjs) adjusts the student weight for students in year- round schools who do not attend school during the time of the assessment. This situation typically arises in overcrowded schools. School administrators in year-round schools randomly assign students to portions of the year in which they attend school and portions of the year in which they do not attend. At the time of assessment, a certain percentage of students (designated as OFF js) do not attend school and thus cannot be assessed. The YRRND_AFjs for a school is calculated as 1/(1- OFF js/100).

NAEP Technical Documentation Website
NAEP Technical Documentation School and Student
Nonresponse Weight Adjustments for the 2013 Assessment
Nonresponse is unavoidable in any voluntary survey of a human population. Nonresponse leads to the loss of sample data that must be compensated for in the weights of the responding sample members. This differs from ineligibility, for which no adjustments are necessary. The purpose of the nonresponse adjustments is to reduce the mean square error of survey estimates. While the nonresponse adjustment reduces the bias from the loss of sample, it also increases variability among the survey weights leading to increased variances of the sample estimates. However, it is presumed that the reduction in bias more than compensates for the increase in
School Nonresponse Weight Adjustment
Student Nonresponse Weight Adjustment
the variance, thereby reducing the mean square error and thus improving the accuracy of survey estimates. Nonresponse adjustments are made in the NAEP surveys at both the school and the student levels: the responding (original and substitute) schools receive a weighting adjustment to compensate for nonresponding schools, and responding students receive a weighting adjustment to compensate for nonresponding students.
The paradigm used for nonresponse adjustment in NAEP is the quasi-randomization approach (Oh and Scheuren 1983). In this approach, school response cells are based on characteristics of schools known to be related to both response propensity and achievement level, such as the locale type (e.g., large principal city of a metropolitan area) of the school. Likewise, student response cells are based on characteristics of the schools containing the students and student characteristics, which are known to be related to both response propensity and achievement level, such as student race/ethnicity, gender, and age.
Under this approach, sample members are assigned to mutually exclusive and exhaustive response cells based on predetermined characteristics. A nonresponse adjustment factor is calculated for each cell as the ratio of the sum of adjusted base weights for all eligible units to the sum of adjusted base weights for all responding units. The nonresponse adjustment factor is then applied to the base weight of each responding unit. In this way, the weights of responding units in the cell are "weighted up" to represent the full set of responding and nonresponding units in the response cell.
The quasi-randomization paradigm views nonresponse as another stage of sampling. Within each nonresponse cell, the paradigm assumes that the responding sample units are a simple random sample from the total set of all sample units. If this model is valid, then the use of the quasi-randomization weighting adjustment will eliminate any nonresponse bias. Even if this model is not valid, the weighting adjustments will eliminate bias if the achievement scores are homogeneous within the response cells (i.e., bias is eliminated if there is homogeneity either in response propensity or in achievement levels). See, for example, chapter 4 of Little and Rubin (1987).

NAEP Technical Documentation School Nonresponse Weight Adjustment
The school nonresponse adjustment procedure inflates the weights of cooperating schools to account for eligible noncooperating schools for which no substitute schools participated. The adjustments are computed within nonresponse cells and are based on the assumption that the cooperating and noncooperating schools within the same cell are more similar to each other than to schools from different cells. School nonresponse adjustments were carried out separately by sample; that is, by
sample
level (state, national), school type (public, private), and grade
(4, 8, 12).
Development of Initial School Nonresponse Cells
Development of Final School Nonresponse Cells
School Nonresponse Adjustment Factor Calculation

NAEP Technical Documentation Development of Initial School Nonresponse Cells
The cells for nonresponse adjustments are generally functions of the school sampling strata for the individual samples. School sampling strata usually differ by assessment subject, grade, and school type (public or private). Assessment subjects that are administered together by way of spiraling have the same school samples and stratification schemes. Subjects that are not spiraled with any other subjects have their own separate school sample. In NAEP 2015, all operational assessments were spiraled together.
The initial nonresponse cells for the various NAEP 2015 samples are described below.
Public School Samples for Reading and Mathematics at Grades 4 and 8
For these samples, initial weighting cells were formed within each jurisdiction using the following nesting cell structure:
 Trial
Urban District Assessment (TUDA) district vs. the balance of the
state for states with TUDA districts, urbanicity (urban-centric
locale) stratum; and
Trial
Urban District Assessment (TUDA) district vs. the balance of the
state for states with TUDA districts, urbanicity (urban-centric
locale) stratum; and
 race/ethnicity
classification stratum, or achievement level, or median income, or
grade enrollment.
race/ethnicity
classification stratum, or achievement level, or median income, or
grade enrollment.
In general, the nonresponse cell structure used race/ethnicity classification stratum as the lowest level variable. However, where there was only one race/ethnicity classification stratum within a particular urbanicity stratum, categorized achievement, median income, or enrollment data were used instead.
Public School Sample at Grade 12
 The
initial weighting cells for this sample were formed using the
following nesting cell structure: census division stratum,
The
initial weighting cells for this sample were formed using the
following nesting cell structure: census division stratum,
urbanicity
stratum (urban-centric locale), and race/ethnicity classification
stratum.
Private School Samples at Grades 4, 8 and 12
The
initial weighting cells for these samples were formed within each
grade using the following nesting cell structure: affiliation,
 census
division stratum,
census
division stratum,
urbanicity
stratum (urban-centric locale), and race/ethnicity classification
stratum.

NAEP Technical Documentation Development of Final School Nonresponse Cells
Limits were placed on the magnitude of cell sizes and adjustment factors to prevent unstable nonresponse adjustments
and unacceptably large nonresponse factors. All initial weighting cells with fewer than six cooperating schools or adjustment factors greater than 3.0 for the full sample weight were collapsed with suitable adjacent cells. Simultaneously, all initial weighting cells for any replicate with fewer than four cooperating schools or adjustment factors greater than the maximum of
or two times the full sample nonresponse adjustment factor were collapsed with suitable adjacent cells. Initial weighting cells were generally collapsed in reverse order of the cell structure; that is, starting at the bottom of the nesting structure and working up toward the top level of the nesting structure.
Public School Samples at Grades 4 and 8
For the grade 4 and 8 public school samples, cells with the most similar race/ethnicity classification within a
given jurisdiction/Trial Urban District Assessment (TUDA) district and urbanicity (urban-centric locale) stratum were collapsed first. If further collapsing was required after all levels of race/ethnicity strata were collapsed, cells with the most similar urbanicity strata were combined next. Cells were never permitted to be collapsed across jurisdictions or TUDA districts.
Public School Sample at Grades 12
For the grade 12 public school sample, race/ethnicity classification cells within a given census division stratum and urbanicity stratum were collapsed first. If further collapsing was required after all levels of race/ethnicity classification were collapsed, cells with the most similar urbanicity strata were combined next. Any further collapsing occurred across census division strata but never across census regions.
Private School Samples at Grades 4, 8, and 12
For the private school samples, cells with the most similar race/ethnicity classification within a given affiliation, census division, and urbanicity stratum were collapsed first. If further collapsing was required after all levels of race/ethnicity strata were collapsed, cells with the most similar urbanicity classification were combined. Any further collapsing occurred across census division strata but never across affiliations.

NAEP Technical Documentation School Nonresponse Adjustment Factor Calculation
In each final school nonresponse adjustment cell c, the school nonresponse adjustment factor SCH_NRAFc was computed as follows:
![]()
where
 Sc
is the set of all eligible sampled schools (cooperating
original and substitute schools and refusing original schools with
noncooperating or no assigned substitute) in cell c,
Sc
is the set of all eligible sampled schools (cooperating
original and substitute schools and refusing original schools with
noncooperating or no assigned substitute) in cell c,
Rc
is the set of all cooperating schools within Sc,
SCH_BWTs is
the school base weight,
SCH_TRIMs
is the school-level weight trimming factor,
SCHSESWTs
is the school-level
session assignment
weight, and
Xs
is the estimated grade enrollment corresponding to the
original sampled school.

NAEP Technical Documentation Student Nonresponse Weight Adjustment
The student nonresponse adjustment procedure inflates the weights of assessed students to account for eligible sampled students who did not participate in the assessment. These inflation factors offset the loss of data associated with absent students. The adjustments are computed within nonresponse cells and are based on the assumption that the assessed and absent students within the same cell are more similar to one another than to students from different cells. Like its counterpart at the school level, the student nonresponse adjustment is
Development of Initial Student Nonresponse Cells
Development of Final Student Nonresponse Cells
Student Nonresponse Adjustment Factor Calculation
intended to reduce the mean square error and thus improve the accuracy of NAEP assessment estimates. Also, like its counterpart at the school level, student nonresponse adjustments were carried out separately by sample; that is, by
grade
(4, 8, 12),
school
type (public, private), and
assessment
subject (mathematics, reading, science, meaning vocabulary).

NAEP Technical Documentation Development of Initial Student Nonresponse Cells for the 2013 Assessment
Initial student nonresponse cells are generally created within each sample as defined by grade, school type (public, private), and assessment subject. However, when subjects are administered together by way of spiraling, the initial student nonresponse cells are created across the subjects in the same spiral. The rationale behind this decision is that spiraled subjects are in the same schools and the likelihood of whether an eligible student participates in an assessment is more related to its school than the subject of the assessment booklet. In NAEP 2013, there was only one spiral, with the reading and mathematics assessments spiraled together. The initial student nonresponse cells for the various NAEP 2013 samples are described below.
Nonresponse adjustment procedures are not applied to excluded students because they are not required to complete an assessment.
Public School Samples for Reading and Mathematics at Grades 4 and 8
The initial student nonresponse cells for these samples were defined within grade, jurisdiction, and Trial Urban District Assessment (TUDA) district using the following nesting cell structure:
students
with disabilities (SD)/English language learners (ELL) by subject,
school nonresponse cell,
age
(classified into "older"1
student and "modal age or younger"
student), gender, and
race/ethnicity.
The highest level variable in the cell structure separates students who were classified either as having disabilities (SD) or as English language learners (ELL) from those who are neither, since SD or ELL students tend to score lower on assessment tests than non-SD/non-ELL students. In addition, the students in the SD or ELL groups are further broken down by subject, since rules for excluding students from the assessment differ by subject. Non-SD and non-ELL students are not broken down by subject, since the exclusion rules do not apply to them.
Public School Samples for Reading and Mathematics at Grade 12
The initial weighting cells for these samples were formed hierarchically within state for the state-reportable samples and the balance of the country for remaining states as follows:
SD/ELL,
school
nonresponse cell,
age
(classified into "older"1
student and "modal age or younger"
student), gender, and
race/ethnicity.
Private School Samples for Reading and Mathematics at Grades 4, 8, and 12
The
initial weighting cells for these private school samples were formed
hierarchically within grade as follows: SD/ELL,
school
nonresponse cell,
age
(classified into "older"1
student and "modal age or younger"
student), gender, and
race/ethnicity.
Although exclusion rules differ by subject, there were not enough SD or ELL private school students to break out by subject as was done for the public schools.
1Older students are those born before October 1, 2002, for grade 4; October 1, 1998, for grade 8; and October 1, 1994, for
grade 12.

NAEP Technical Documentation Development of Final Student Nonresponse Cells for the 2013 Assessment
Similar to the school nonresponse adjustment, cell and adjustment factor size constraints are in place to prevent unstable nonresponse adjustments or unacceptably large adjustment factors. All initial weighting cells with either fewer than 20 participating students or adjustment factors greater than 2.0 for the full sample weight were collapsed with suitable adjacent cells. Simultaneously, all initial weighting cells for any replicate with either fewer than 15 participating students or an adjustment factor greater than the maximum of 2.0 or 1.5 times the full sample nonresponse adjustment factor were collapsed with suitable adjacent cells.
Initial weighting cells were generally collapsed in reverse order of the cell structure; that is, starting at the bottom of the nesting structure and working up toward the top level of the nesting structure. Race/ethnicity cells within SD/ELL groups, school nonresponse cell, age, and gender classes were collapsed first. If further collapsing was required after collapsing all race/ethnicity classes, cells were next combined across gender, then age, and finally school nonresponse cells. Cells are never collapsed across SD and ELL groups for any sample.

NAEP Technical Documentation Student Nonresponse Adjustment Factor Calculation
In each final student nonresponse adjustment cell c for a given sample, the student nonresponse adjustment factor STU_NRAFc was computed as follows:
![]()
where

 Sc
is the set of all eligible sampled students in cell c
for a given sample, Rc is
the set of all assessed students within Sc,
Sc
is the set of all eligible sampled students in cell c
for a given sample, Rc is
the set of all assessed students within Sc,
STU_BWTk
is the
student
base weight
for a
given student
k,
 SCH_TRIMk
is the school-level weight trimming factor for
the school associated with student k, SCH_NRAFk
is the school-level nonresponse adjustment factor
for the school associated with student k,
and SUBJFACk
is the subject factor for a given student k.
SCH_TRIMk
is the school-level weight trimming factor for
the school associated with student k, SCH_NRAFk
is the school-level nonresponse adjustment factor
for the school associated with student k,
and SUBJFACk
is the subject factor for a given student k.
The student weight used in the calculation above is the adjusted student base weight, without regard to subject, adjusted for school weight trimming and school nonresponse.
Nonresponse adjustment procedures are not applied to excluded students because they are not required to complete an assessment. In effect, excluded students were placed in a separate nonresponse cell by themselves and all received an adjustment factor of 1. While excluded students are not included in the analysis of the NAEP scores, weights are provided for excluded students in order to estimate the size of this group and its population characteristics.

NAEP Technical Documentation School and Student Weight Trimming Adjustments for the 2013 Assessment
Weight trimming is an adjustment procedure that involves detecting and reducing extremely large weights. "Extremely large weights" generally refer to large sampling weights that were not anticipated in the design of the sample. Unusually large weights are likely to produce large sampling variances for statistics of interest, especially when the large weights are associated with sample cases reflective of rare or atypical characteristics. To reduce the impact of these large weights on variances, weight reduction methods are typically employed. The goal of employing weight reduction methods is to reduce the mean square error of survey estimates. While the
Trimming of School Base Weights
Trimming of Student Weights
trimming of large weights reduces variances, it also introduces some bias. However, it is presumed that the reduction in the variances more than compensates for the increase in the bias, thereby reducing the mean square error and thus improving the accuracy of survey estimates (Potter 1988). NAEP employs weight trimming at both the school and student levels.

NAEP Technical Documentation Trimming of School Base Weights
Large school weights can occur for schools selected from the NAEP new-school sampling frame and for private schools. New schools that are eligible for weight trimming are schools with a disproportionately large student enrollment in a particular grade from a school district that was selected with a low probability of selection. The school base weights for such schools may be large relative to what they would have been if they had been selected as part of the original sample.
To detect extremely large weights among new schools, a comparison was made between a new school's school base weight and its ideal weight (i.e., the weight that would have resulted had the school been selected from the original school sampling frame). If the school base weight was more than three times the ideal weight, a trimming factor was calculated for that school that scaled the base weight back to three times the ideal weight. The calculation of the school-level trimming factor for a new school s is expressed in the following formula:
![]()
where
 EXP_WTs
is the ideal base weight the school would have
received if it had been on the NAEP public school sampling frame, and
EXP_WTs
is the ideal base weight the school would have
received if it had been on the NAEP public school sampling frame, and
SCH_BWTs
is the actual school base weight the school
received as a sampled school from the new school frame.
Thirty-seven (37) schools out of 377 selected from the new-school sampling frame had their weights trimmed: eight at grade 4, 29 at grade 8, and zero at grade 12.
Private schools eligible for weight trimming were Private School Universe Survey (PSS) nonrespondents who were found subsequently to have either larger enrollments than assumed at the time of sampling, or an atypical probability of selection given their affiliation, the latter being unknown at the time of sampling. For private school s, the formula for computing the school-level weight trimming factor SCH_TRIMs is identical to that used for new schools. For private schools,
EXP_WTs
is the ideal base weight the school would have
received if it had been on the NAEP private school sampling frame
with accurate enrollment and known affiliation, and
SCH_BWTs
is the actual school base weight the school received as
a sampled private school.
No private schools had their weights trimmed.

NAEP Technical Documentation Trimming of Student Weights
Large student weights generally come from compounding nonresponse adjustments at the school and student levels with artificially low school selection probabilities, which can result from inaccurate enrollment data on the school frame used to define the school size measure. Even though measures are in place to limit the number and size of excessively large weights—such as the implementation of adjustment factor size constraints in both the school and student nonresponse procedures and the use of the school trimming procedure—large student weights can occur due to compounding effects of the various weighting components.
The student weight trimming procedure uses a multiple median rule to detect excessively large student weights. Any student weight within a given trimming group greater than a specified multiple of the median weight value of the given trimming group has its weight scaled back to that threshold. Student weight trimming was implemented separately by grade, school type (public or private), and subject. The multiples used were 3.5 for public school trimming groups and 4.5 for private school trimming groups. Trimming groups were defined by jurisdiction and Trial Urban District Assessment (TUDA) districts for the public school samples at grades 4 and 8; by dichotomy of low/high percentage of Black and Hispanic students (15 percent and below, above 15 percent) for the public school sample at grade 12; and by affiliation (Catholic, Non-Catholic) for private school samples at grades 4, 8 and 12.
The procedure computes the median of the nonresponse-adjusted student weights in the trimming group g for a given grade and subject sample. Any student k with a weight more than M times the median received a trimming factor calculated as follows:
![]()
where
M
is the trimming multiple,
 MEDIANg
is the median of nonresponse-adjusted student
weights in trimming group g, and STUWGTgk
is the weight after student nonresponse
adjustment for student k in trimming group g.
MEDIANg
is the median of nonresponse-adjusted student
weights in trimming group g, and STUWGTgk
is the weight after student nonresponse
adjustment for student k in trimming group g.
In the 2013 assessment, relatively few students had weights considered excessively large. Out of the approximately 840,000 students included in the combined 2013 assessment samples, 226 students had their weights trimmed.

NAEP Technical Documentation Student Weight Raking Adjustment for the 2013 Assessment
Weighted estimates of population totals for student-level subgroups for a given grade will vary across subjects even though the student samples for each subject generally come from the same schools. These differences are the result of sampling error associated with the random assignment of subjects to students through a process known as spiraling. For state assessments in particular, any
Development of Final Raking Dimensions Raking Adjustment Control Totals
Raking Adjustment Factor Calculation
difference in demographic estimates between subjects, no matter how small, may raise concerns about data quality. To remove these random differences and potential data quality concerns, a new step was added to the NAEP weighting procedure starting in 2009. This step adjusts the student weights in such a way that the weighted sums of population totals for specific subgroups are the same across all subjects. It was implemented using a raking procedure and applied only to state-level assessments.
Raking is a weighting procedure based on the iterative proportional fitting process developed by Deming and Stephan (1940) and involves simultaneous ratio adjustments to two or more marginal distributions of population totals. Each set of marginal population totals is known as a dimension, and each population total in a dimension is referred to as a control total. Raking is carried out in a sequence of adjustments. Sampling weights are adjusted to one marginal distribution and then to the second marginal distribution, and so on. One cycle of sequential adjustments to the marginal distributions is called an iteration. The procedure is repeated until convergence is achieved. The criterion for convergence can be specified either as the maximum number of iterations or an absolute difference (or relative absolute difference) from the marginal population totals. More discussion on raking can be found in Oh and Scheuren (1987).
For NAEP 2013, the student raking adjustment was carried out separately in each state for the reading
and mathematics public school samples at grades 4 and 8, and in the 13 states with state-reportable samples for the reading and mathematics public school samples at grade 12. The dimensions used in the raking process were National School Lunch Program (NSLP) eligibility, race/ethnicity, SD/ELL status, and gender. The control totals for these dimensions were obtained from the NAEP student sample weights of the reading
and mathematics samples combined.
NAEP Technical Documentation Development of Final Raking Dimensions
The raking procedure involved four dimensions. The variables used to define the dimensions are listed below along with the categories making up the initial raking cells for each dimension.
National
School Lunch Program (NSLP) eligibility
Eligible for free or reduced-price lunch
-
Otherwise
Race/Ethnicity
White, not Hispanic
Black, not Hispanic
Hispanic
Asian
American Indian/Alaska Native
Native Hawaiian/Pacific Islander
-
Two
or
More
Races
SD/ELL
status
SD, but not ELL
ELL, but not SD
SD and ELL
-
Neither
SD nor
ELL
Gender
Male
Female
In states containing districts that participated in Trial Urban District Assessments (TUDA) districts at grades 4 and 8, the initial cells were created separately for each TUDA district and the balance of the state. Similar to the procedure used for school and student nonresponse adjustments, limits were placed on the magnitude of the cell sizes and adjustment factors to prevent unstable raking adjustments that could have resulted in unacceptably large or small adjustment factors. Levels of a dimension were combined whenever there were fewer than 30 assessed or excluded students (20 for any of the replicates) in a category, if the smallest adjustment was less than 0.5, or if the largest adjustment was greater than 2 for the full sample or for any replicate.
If collapsing was necessary for the race/ethnicity dimension, the following groups were combined first: American Indian/Alaska Native with Black, not Hispanic; Hawaiian/Pacific Islander with Black, not Hispanic; Two or More Races with White, not Hispanic; Asian with White, not Hispanic; and Black, not Hispanic with Hispanic. If further collapsing was necessary, the five categories American Indian/Alaska Native; Two or More Races; Asian; Native Hawaiian/Pacific Islander; and White, not Hispanic were combined. In some instances, all seven categories had to be collapsed.
If collapsing was necessary for the SD/ELL dimension, the SD/not ELL and SD/ELL categories were combined first, followed by ELL/not SD if further collapsing was necessary. In some instances, all four categories had to be collapsed.

NAEP Technical Documentation Raking Adjustment Control Totals for the 2013 Assessment
The control totals used in the raking procedure for NAEP 2013 grades 4, 8, and 12 were estimates of the student population derived from the set of assessed and excluded students pooled across subjects. The control totals for category c within dimension d were computed as follows:
![]()
where
Rc(d)
is the set of all assessed students in category c of
dimension d, Ec(d) is
the set of all excluded students in category c of dimension d,
STU_BWTk
is the student
base weight for a given
student k,
SCH_TRIMk
is the school-level weight trimming factor for
the school associated with student k,
SCH_NRAFk
is the school-level nonresponse adjustment factor
for the school associated with student k,
STU_NRAFk
is the student-level nonresponse adjustment
factor for student k, and
SUBJFACk
is the subject factor for student k.
The student weight used in the calculation of the control totals above is the adjusted student base weight, without regard to subject, adjusted for school weight trimming, school nonresponse, and student nonresponse. Control totals were computed for the full sample and for each replicate independently.

NAEP Technical Documentation Raking Adjustment Factor Calculation for the 2013 Assessment
For assessed and excluded students in a given subject, the raking adjustment factor STU_RAKEk was computed as follows:
First, the weight for student k was initialized as follows:
![]()
where
STU_BWTk is the student base weight for a given student k,
SCH_TRIMk
is the school-level weight trimming factor for
the school associated with student k, SCH_NRAFk
is the school-level nonresponse adjustment
factor for the school associated with student k,
STU_NRAFk
is the student-level nonresponse adjustment
factor for student k, and
SUBJFACk
is the subject factor for student k.
Then, the sequence of weights for the first iteration was calculated as follows for student k in category c of dimension d:
For dimension 1:
![]()
For dimension 2:
![]()
For dimension 3:
![]()
For dimension 4:
![]()
where
Rc(d)
is the set of all assessed students in category c of
dimension d, Ec(d) is
the set of all excluded students in category c of dimension d, and
Totalc(d) is
the control total for category c of dimension d.
k
convergence was reached.
Once the process converged, the adjustment factor was computed as follows:
![]()
where STUSAWTk is the weight for student k after convergence.
The process was done independently for the full sample and for each replicate.
NAEP Technical Documentation Website
NAEP Technical Documentation Computation of Replicate Weights for the 2013 Assessment
In addition to the full-sample weight, a set of 62 replicate weights was provided for each student. These replicate weights are used in calculating the sampling variance of estimates obtained from the data, using the jackknife repeated replication method. The method of deriving these weights was aimed at reflecting the features of the sample design appropriately for each sample, so that when the jackknife variance estimation procedure is implemented, approximately unbiased estimates of sampling variance are
obtained. This section gives the specifics for generating the
Defining Variance Strata and Forming Replicates
Computing School-Level Replicate Factors
Computing Student-Level Replicate Factors
Replicate Variance Estimation
replicate weights for the 2013 assessment samples. The theory that underlies the jackknife variance estimators used in NAEP studies is discussed in the section Replicate Variance Estimation.
In general, the process of creating jackknife replicate weights takes place at both the school and student level. The precise implementation differs between those samples that involve the selection of Primary Sampling Units (PSUs) and those where the school is the first stage of sampling. The procedure for this second kind of sample also differed starting in 2011 from all previous NAEP assessments. The change that was implemented permitted the introduction of a finite population correction factor at the school sampling stage, developed by Rizzo and Rust (2011). In assessments prior to 2011, this adjustment factor has always been implicitly assumed equal to 1.0, resulting in some overestimation of the sampling variance.
For each sample, the calculation of replicate weighting factors at the school level was conducted in a series of steps. First, each school was assigned to one of 62 variance estimation strata. Then, a random subset of schools in each variance estimation stratum was assigned a replicate factor of between 0 and 1. Next, the remaining subset of schools in the same variance stratum was assigned a complementary replicate factor greater than 1. All schools in the other variance estimation strata were assigned a replicate factor of exactly 1. This process was repeated for each of the 62 variance estimation strata so that 62 distinct replicate factors were assigned to each school in the sample.
This process was then repeated at the student level. Here, each individual sampled student was assigned to one of 62 variance estimation strata, and 62 replicate factors with values either between 0 and 1, greater than 1, or exactly equal to 1 were assigned to each student.
For example, consider a single hypothetical student. For replicate 37, that student’s student replicate factor might be 0.8, while for the school to which the student belongs, for replicate 37, the school replicate factor might be 1.6. Of course, for a given student, for most replicates, either the student replicate factor, the school replicate factor, or (usually) both, is equal to 1.0.
A replicate weight was calculated for each student, for each of the 62 replicates, using weighting procedures similar to those used for the full-sample weight. Each replicate weight contains the school and student replicate factors described above. By repeating the various weighting procedures on each set of replicates, the impact of these procedures on the sampling variance of an estimate is appropriately reflected in the variance estimate.
Each of the 62 replicate weights for student k in school s in stratum j can be expressed as follows:
![]()
where
STU_BWTjsk
is the
student
base weight;

 SCH_REPFACjs(r)
is the school-level replicate factor for replicate r;
SCH_NRAFjs(r)
is the school-level nonresponse adjustment factor for
replicate r; STU_REPFACjsk(r)
is the student-level replicate factor for replicate r;
STU_NRAFjsk(r)
is the
student-level
nonresponse adjustment
factor for
replicate r;
SCH_TRIMjs
is the school-level weight trimming adjustment
factor; STU_TRIMjsk
is the student-level weight trimming adjustment
factor; and STU_RAKEjsk(r)
is the
student-level
raking adjustment
factor for
replicate r.
SCH_REPFACjs(r)
is the school-level replicate factor for replicate r;
SCH_NRAFjs(r)
is the school-level nonresponse adjustment factor for
replicate r; STU_REPFACjsk(r)
is the student-level replicate factor for replicate r;
STU_NRAFjsk(r)
is the
student-level
nonresponse adjustment
factor for
replicate r;
SCH_TRIMjs
is the school-level weight trimming adjustment
factor; STU_TRIMjsk
is the student-level weight trimming adjustment
factor; and STU_RAKEjsk(r)
is the
student-level
raking adjustment
factor for
replicate r.
Specific school and student nonresponse and student-level raking adjustment factors were calculated separately for each replicate, thus the use of the index (r), and applied to the replicate student base weights. Computing separate nonresponse and raking adjustment factors for each replicate allows resulting variances from the use of the final student replicate weights to reflect components of variance due to these various weight adjustments.
School and student weight trimming adjustments were not replicated, that is, not calculated separately for each replicate. Instead, each replicate used the school and student trimming adjustment factors derived for the full sample. Statistical theory for replicating trimming adjustments under the jackknife approach has not been developed in the literature. Due to the absence of a statistical framework, and since relatively few school and student weights in NAEP require trimming, the weight trimming adjustments were not replicated.

NAEP Technical Documentation Defining Variance Strata and Forming Replicates for the 2013 Assessment
In the NAEP 2013 assessment, replicates were formed separately for each sample indicated by grade (4, 8, 12), school type (public, private), and assessment subject (mathematics, reading). To reflect the school-level finite population corrections in the variance estimators for the two-stage samples used for the mathematics and reading assessments, replication was carried out at both the school and student levels.
The first step in forming replicates was to create preliminary variance strata in each primary stratum. This was done by sorting the appropriate sampling unit (school or student) in the order of its selection within the primary stratum and then pair off adjacent sampling units into preliminary variance strata. Sorting sample units by their order of sample selection reflects the implicit stratification and systematic sampling features of the sample design. Within each primary stratum with an even number of sampling units, all of the preliminary variance strata consisted of pairs of sampling units. However, within primary strata with an odd number of sampling units, all but one variance strata consisted of pairs of sampling units, while the last one consisted of three sampling units.
The next step is to form the final variance strata by combining preliminary strata if appropriate. If there were more than 62 preliminary variance strata within a primary stratum, the preliminary variance strata were grouped to form 62 final variance strata. This grouping effectively maximized the distance in the sort order between grouped preliminary variance strata. The first 62 preliminary variance strata, for example, were assigned to 62 different final variance strata in order (1 through 62), with the next 62 preliminary variance strata assigned to final variance strata 1 through 62, so that, for example, preliminary variance stratum 1, preliminary variance stratum 63, preliminary variance stratum 125 (if in fact there were that many), etc., were all assigned to the first final variance stratum.
If, on the other hand, there were fewer than 62 preliminary variance strata within a primary stratum, then the number of final variance strata was set equal to the number of preliminary variance strata. For example, consider a primary stratum with 111 sampled units sorted in their order of selection. The first two units were in the first preliminary variance stratum; the next two units were in the second preliminary variance stratum, and so on, resulting in 54 preliminary variance strata with two sample units each (doublets). The last three sample units were in the 55th preliminary variance stratum (triplet). Since there are no more than 62 preliminary variance strata, these were also the final variance strata.
Within each preliminary variance stratum containing a pair of sampling units, one sampling unit was randomly assigned as the first variance unit and the other as the second variance unit. Within each preliminary variance stratum containing three sampling units, the three first-stage units were randomly assigned variance units 1 through 3.
Reading and Mathematics Assessments
At the school-level for these samples, formation of preliminary variance strata did not pertain to certainty schools, since they are not subject to sampling variability, but only to noncertainty schools. The primary stratum for noncertainty schools was the highest school-level sampling stratum variable listed below, and the order of selection was defined by sort order on the school sampling frame.
Trial
Urban District Assessment (TUDA) districts, remainder of states (for
states with TUDAs), or entire states for the public school samples at
grades 4, 8, and 12; and
Private
school affiliation (Catholic, non-Catholic) for the private school
samples at grades 4, 8, and 12.
At the student-level, all students were assigned to variance strata. The primary stratum was school, and the order of selection was defined by session number and position on the administration schedule.
Within each pair of preliminary variance strata, one first-stage unit, designated at random, was assigned as the first variance unit and the other first-stage unit as the second variance unit. Within each triplet preliminary variance stratum, the three schools were randomly assigned variance units 1 through 3.

NAEP Technical Documentation Computing School- Level Replicate Factors for the 2013 Assessment
The replicate variance estimation approach for the mathematics and reading assessments involved finite population corrections at the school level. The calculation of school-level replicate factors for these assessments depended upon whether or not a school was selected with certainty. For certainty schools, the school-level replicate factors for all replicates are set to unity – this is true regardless of whether or not the variance replication method uses finite population corrections – since certainty schools are not subject to sampling variability. Alternatively, one can view the finite population correction factor for such schools as being equal to zero. Thus, for each certainty school in a given assessment, the school-level replicate factor for each of the 62 replicates (r = 1, ..., 62) was assigned as follows:
![]()
where SCH_REPFACjs(r) is the school-level replicate factor for school s in primary stratum j for the r-th replicate.
For noncertainty schools, where preliminary variance strata were formed by grouping schools into pairs or triplets, school-level replicate factors were calculated for each of the 62 replicates based on this grouping. For schools in variance strata comprising pairs of schools, the school-level replicate factors,SCH_REPFACjs(r),r = 1,..., 62, were calculated as follows:
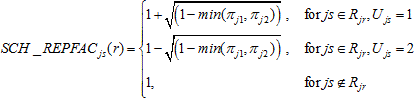
where
min(πj1, πj2) is the smallest school probability between the two schools comprising Rjr,
Rjr
is the set of schools within the r-th variance stratum
for primary stratum j, and Ujs
is the variance unit (1 or 2) for school s in primary
stratum j.
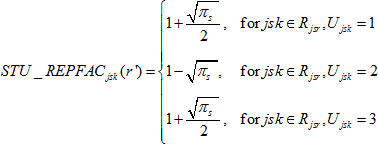
For noncertainty schools in preliminary variance strata comprising three schools, the school-level replicate factors SCH_REPFACjs(r), r = 1,..., 62 were calculated as follows:
For school s from primary stratum j, variance stratum r,
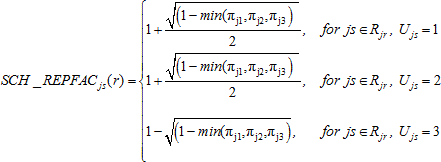
while for r' = r + 31 (mod 62):
and for all other r* other than r and r' :
![]()
where
min(πj1, πj2,πj3) is the smallest school probability among the three schools comprising Rjr,
Rjr
is the set of schools within the r-th variance stratum
for primary stratum j, and Ujs
is the variance unit (1, 2, or 3) for school s in
primary stratum j.
In primary strata with fewer than 62 variance strata, the replicate weights for the “unused” variance strata (the remaining ones up to 62) for these schools were set equal to the school base weight (so that those replicates contribute nothing to the variance estimate).

NAEP Technical Documentation Website
NAEP Technical Documentation Computing Student- Level Replicate Factors for the 2013 Assessment
For the mathematics and reading assessments, which involved school-level finite population corrections, the student- level replication factors were calculated the same way regardless of whether or not the student was in
a certainty school.
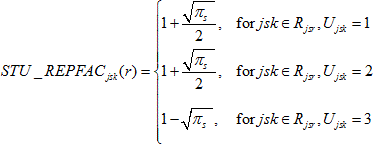
For students in student-level variance strata comprising pairs of students, the student-level replicate factors, STU_REPFACjsk(r), r = 1,..., 62, were calculated as follows:
![]()
where
πs
is the probability of selection for school s,
 Rjsr
is the set of students within the r-th variance stratum
for school s in primary stratum j, and Ujsk
is the variance unit (1 or 2) for student k in school s
in stratum j.
Rjsr
is the set of students within the r-th variance stratum
for school s in primary stratum j, and Ujsk
is the variance unit (1 or 2) for student k in school s
in stratum j.
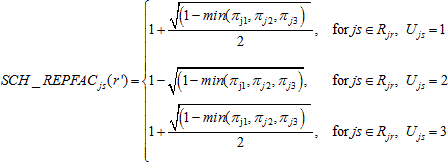
For students in variance strata comprising three students, the student-level replicate factors STU_REPFACjsk(r), r = 1,..., 62, were calculated as follows:
while for r' = r + 31 (mod 62):
and for all other r* other than r and r' :
![]()
where
πs
is the probability of selection for school s,
Rjsr
is the set of students within the r-th replicate stratum
for school s in stratum j, and Ujsk
is the variance unit (1, 2, or 3) for student k in
school s in stratum j.
Note, for students in certainty schools, where πs = 1, the student replicate factors are 2 and 0 in the case of pairs, and 1.5, 1.5, and 0 in the case of triples.
NAEP Technical Documentation Website
NAEP Technical Documentation Replicate Variance Estimation for the 2013 Assessment
Variances for NAEP assessment estimates are computed using the paired jackknife replicate variance procedure. This technique is applicable for common statistics, such as means and ratios, and differences between these for different subgroups, as well as for more complex statistics such as linear or logistic regression coefficients.
In general, the paired jackknife replicate variance procedure involves initially pairing clusters of first-stage sampling units to form H variance strata (h = 1, 2, 3, ...,H) with two units per stratum. The first replicate is formed by assigning, to one unit at random from the first variance stratum, a replicate weighting factor of less than 1.0, while assigning the remaining unit a complementary replicate factor greater than 1.0, and assigning all other units from the other (H - 1) strata a replicate factor of 1.0. This procedure is carried out for each variance stratum resulting in H replicates, each of which provides an estimate of the population total.
In general, this process is repeated for subsequent levels of sampling. In practice, this is not practicable for a design with three or more stages of sampling, and the marginal improvement in precision of the variance estimates would be negligible in all such cases in the NAEP setting. Thus in NAEP, when a two-stage design is used – sampling schools and then students – beginning in 2011 replication is carried out at both stages. (See Rizzo and Rust (2011) for a description of the methodology.) When a three-stage design is used, involving the selection of geographic Primary Sampling Units (PSUs), then schools, and then students, the replication procedure is only carried out at the first stage of sampling (the PSU stage for noncertainty PSUs, and the school stage within certainty PSUs). In this situation, the school and student variance components are correctly estimated, and the overstatement of the between-PSU variance component is relatively very small.
The jackknife estimate of the variance for any given statistic is given by the following formula:
![]()
where
![]()
![]() represents
the full sample estimate of the given statistic, and represents the
corresponding estimate for replicate h.
represents
the full sample estimate of the given statistic, and represents the
corresponding estimate for replicate h.
Each replicate undergoes the same weighting procedure as the full sample so that the jackknife variance estimator reflects the contributions to or reductions in variance resulting from the various weighting adjustments.
The NAEP jackknife variance estimator is based on 62 variance strata resulting in a set of 62 replicate weights assigned to each school and student.
The basic idea of the paired jackknife variance estimator is to create the replicate weights so that use of the jackknife procedure results in an unbiased variance estimator for simple totals and means, which is also reasonably efficient (i.e., has a low variance as a variance estimator). The jackknife variance estimator will then produce a consistent (but not fully unbiased) estimate of variance for (sufficiently smooth) nonlinear functions of total and mean estimates such as ratios, regression coefficients, and so forth (Shao and Tu, 1995).
The development below shows why the NAEP jackknife variance estimator returns an unbiased variance estimator for totals and means, which is the cornerstone to the asymptotic results for nonlinear estimators. See for example Rust (1985). This paper also discusses why this variance estimator is generally efficient (i.e., more reliable than alternative approaches requiring similar computational resources).
The development is done for an estimate of a mean based on a simplified sample design that closely approximates the sample design for first-stage units used in the NAEP studies. The sample design is a stratified random sample with H strata with population weights Wh, stratum sample sizes nh, and stratum
![]()
![]() sample
means . The population
estimator and standard unbiased variance estimator
sample
means . The population
estimator and standard unbiased variance estimator
![]() are:
are:
![]()
with
![]()
![]() The
paired jackknife replicate variance estimator assigns one replicate
h=1,…, H to each stratum, so that the number of replicates
equals H. In NAEP, the replicates correspond generally to pairs and
triplets (with the latter only being used if there are an odd number
of sample units within a particular primary stratum generating
replicate strata). For pairs, the process of generating replicates
can be viewed as taking a simple random sample (J) of size nh/2
within the replicate stratum, and assigning an increased weight to
the sampled elements, and a decreased weight to the unsampled
elements. In certain applications, the increased weight is double the
full sample weight, while the decreased weight is in fact equal to
zero. In this
The
paired jackknife replicate variance estimator assigns one replicate
h=1,…, H to each stratum, so that the number of replicates
equals H. In NAEP, the replicates correspond generally to pairs and
triplets (with the latter only being used if there are an odd number
of sample units within a particular primary stratum generating
replicate strata). For pairs, the process of generating replicates
can be viewed as taking a simple random sample (J) of size nh/2
within the replicate stratum, and assigning an increased weight to
the sampled elements, and a decreased weight to the unsampled
elements. In certain applications, the increased weight is double the
full sample weight, while the decreased weight is in fact equal to
zero. In this
![]() simplified
case, this assignment reduces to
replacing with , the
latter being
the sample
mean of the
sampled nh/2
units. Then the replicate estimator corresponding to stratum r
is
simplified
case, this assignment reduces to
replacing with , the
latter being
the sample
mean of the
sampled nh/2
units. Then the replicate estimator corresponding to stratum r
is
![]()
![]() The
r-th term in the sum of squares
for is thus:
The
r-th term in the sum of squares
for is thus:
![]()
In stratified random sampling, when a sample of size nr/2 is drawn without replacement from a population of size nr,, the sampling variance is
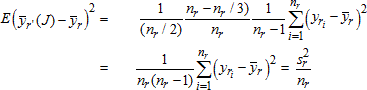
See for example Cochran (1977), Theorem 5.3, using nr, as the “population size,” nr/2 as the “sample size,” and sr2 as the “population variance” in the given formula. Thus,
![]()
Taking the expectation over all of these stratified samples of size nr/2, it is found that
![]()
In this sense, the jackknife variance estimator “gives back” the sample variance estimator for means and totals as desired under the theory.
In cases where, rather than doubling the weight of one half of one variance stratum and assigning a zero weight to the other, the weight of one unit is multiplied by a replicate factor of (1+δ), while the other is multiplied by (1- δ), the result is that
![]()
In this way, by setting δ equal to the square root of the finite population correction factor, the jackknife variance estimator is able to incorporate a finite population correction factor into the variance estimator.
In practice, variance strata are also grouped to make sure that the number of replicates is not too large (the total number of variance strata is usually 62 for NAEP). The randomization from the original sample distribution guarantees that the sum of squares contributed by each replicate will be close to the target expected value.
For triples, the replicate factors are perturbed to something other than 1.0 for two different replicate factors, rather than just one as in the case of pairs. Again in the simple case where replicate factors that are less than 1 are all set to 0, with the replicate weight factors calculated as follows.
For unit i in variance stratum r
![]()
where weight wi is the full sample base weight.
Furthermore, for r' = r + 31 (mod 62):
![]()
And for all other values r*, other than r and r´,wi(r*) = 1.
![]()
![]()
![]()
![]()
![]()
![]() In
the case
of stratified
random sampling,
this formula
reduces to
replacing with for replicate
r,
where is the
sample mean
from a
“2/3” sample
of 2nr/3
units from
the nr
sample units
In
the case
of stratified
random sampling,
this formula
reduces to
replacing with for replicate
r,
where is the
sample mean
from a
“2/3” sample
of 2nr/3
units from
the nr
sample units
in the replicate stratum, and replacing with for replicate r', where is the sample mean from another overlapping “2/3” sample of 2nr/3 units from the nr sample units in the replicate stratum.
The r-th and r´-th replicates can be written as:
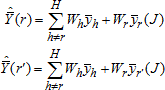
From these formulas, expressions for the r-th and r´-th components of the jackknife variance estimator are obtained (ignoring other sums of squares from other grouped components attached to those replicates):
![]()
These sums of squares have expectations as follows, using the general formula for sampling variances:
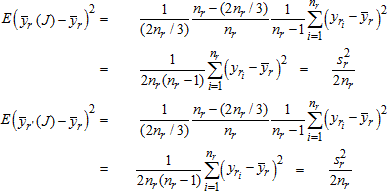
Thus,
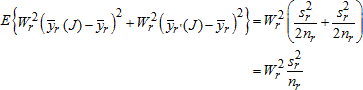
as desired again.

NAEP Technical Documentation Website
NAEP Technical Documentation Quality Control on Weighting Procedures for the 2013 Assessment
Given the complexity of the weighting procedures utilized in NAEP, a range of quality control (QC) checks was conducted throughout the weighting process to identify potential problems with collected student-level demographic data or with specific weighting procedures. The QC processes included
 checks
performed within each step of the weighting process; checks
performed across adjacent steps of the weighting process; review of
participation, exclusion, and accommodation rates; checking
demographic data of individual schools;
checks
performed within each step of the weighting process; checks
performed across adjacent steps of the weighting process; review of
participation, exclusion, and accommodation rates; checking
demographic data of individual schools;
comparisons
with 2011 demographic data; and nonresponse bias analyses.
Final Participation, Exclusion, and Accommodation Rates
Nonresponse Bias Analyses
To validate the weighting process, extensive tabulations of various school and student characteristics at different stages of the process were conducted. The school-level characteristics included in the tabulations were minority
enrollment, median income (based on the school ZIP code area), and urban-centric locale. At the student level, the tabulations included race/ethnicity, gender, relative age, students with disability (SD) status, English language learners (ELL) status, and participation status in National School Lunch Program (NSLP).
NAEP Technical Documentation Website
NAEP Technical Documentation Final Participation, Exclusion, and Accommodation Rates for the 2013 Assessment
Final participation, exclusion, and accommodation rates are presented in quality control tables for each grade and subject by geographic domain and school type. School-level
participation rates have been calculated according to National Center for Education Statistics (NCES) standards as they have been for previous assessments.
School-level participation rates were below 85 percent for private schools at all three grades (4, 8, and 12). Student-level participation rates were also below 85 percent for grade 12 public school student sample overall and in specific states: Connecticut, Florida, Illinois, Iowa, Massachusetts, New Hampshire, New Jersey, and West Virginia. As required by NCES standards, nonresponse bias analyses were conducted on each reporting group falling below the 85 percent participation threshold.
Grade 4 Mathematics
Grade 4 Reading
Grade 8 Mathematics
Grade 8 Reading
Grade 12 Mathematics
Grade 12 Reading

National
all1
8,590
97.27
90.32
209,800
1.41
94.57
13.44
National
public
8,060
99.69
99.54
202,700
1.52
94.49
14.22 

NAEP Technical Documentation Participation, Exclusion, and Accommodation Rates for Grade 4 Mathematics for the 2013 Assessment
The following table displays the school- and student-level response, exclusion, and accommodation rates for the grade 4 mathematics assessment by school type and jurisdiction. Various weights were used in the calculation of the rates, as indicated in the column headings of the table.
The participation rates reflect the participation of the original sample schools only and do not reflect any effect of substitution. The rates weighted by the base weight and enrollment show the approximate proportion of the student population in the jurisdiction that is represented by the responding schools in the sample. The rates weighted by just the base weight show the proportion of the school population that is represented by the responding schools in the sample. These rates differ because schools differ in size.
Participation, exclusion, and accommodation rates, grade 4 mathematics assessment, by school type and jurisdiction: 2013
-
School
School
participation
participation
rates
rates
Number
(percent)
(percent)
Weighted
of
before
before
student
schools
substitution
substitution
Number
Weighted
participation
in
(weighted
(weighted
of
percent
rates
Weighted
School type
original
by base
by base
students
of
(percent)
percent of
and
sample,
weight and
weight
sampled,
students
after
students
jurisdiction
rounded
enrollment)
only)
rounded
excluded
makeups
accommodated
All
8,760
97.30
90.45
214,900
1.40
94.57
13.55
Northeast all
1,480
95.63
85.22
34,500
1.29
93.85
15.68
Midwest all
2,190
97.27
88.80
47,300
1.32
94.84
12.87
South all
2,740
98.20
93.44
73,600
1.37
94.71
14.38
West all
2,120
96.86
91.04
51,800
1.62
94.57
10.98
Alabama
120
100.00
100.00
3,200
1.10
94.82
5.15
Alaska
200
99.48
96.56
3,100
1.14
93.18
21.85
Arizona
120
100.00
100.00
3,400
1.20
95.07
12.97
Arkansas
120
100.00
100.00
3,400
1.24
94.66
15.16
California
300
99.17
98.75
9,000
1.93
94.79
8.78
Colorado
120
100.00
100.00
3,400
1.15
92.34
12.11
Connecticut
120
97.22
97.25
3,200
1.36
93.85
15.52
Delaware
100
100.00
100.00
3,400
2.10
94.36
13.58
District of Columbia
140
100.00
100.00
2,300
1.37
95.09
17.59
Florida
240
100.00
100.00
6,900
1.84
94.11
20.24
Georgia
170
100.00
100.00
5,300
1.43
94.18
11.22
Hawaii
120
100.00
100.00
3,500
1.25
94.70
10.64
Idaho
130
100.00
100.00
3,500
1.29
95.24
9.58
Illinois
200
97.98
98.40
5,100
1.00
94.40
15.44
Indiana
120
100.00
100.00
3,300
1.52
95.18
17.03
Iowa
140
100.00
100.00
3,100
0.70
95.16
14.50
Kansas
150
100.00
100.00
3,400
1.62
94.79
15.16
Kentucky
160
100.00
100.00
4,700
1.45
94.67
11.30
Louisiana
130
100.00
100.00
3,300
1.08
94.49
18.38
Maine
160
100.00
100.00
3,400
2.11
93.95
17.44
Maryland
170
100.00
100.00
4,700
0.99
94.22
17.30
Massachusetts
190
100.00
100.00
5,200
2.03
93.74
17.18
Michigan
190
100.00
100.00
4,600
1.96
94.14
11.02
Minnesota
130
100.00
100.00
3,500
1.37
94.85
10.62
Mississippi
120
100.00
100.00
3,300
0.76
95.44
6.73
Missouri
130
100.00
100.00
3,600
1.41
95.42
11.20
Montana
200
99.85
98.28
3,400
1.68
93.92
8.56
Nebraska
170
100.00
100.00
3,500
1.72
95.37
14.37
Nevada
120
100.00
100.00
3,500
1.41
95.75
22.90
New Hampshire
130
100.00
100.00
3,400
1.22
93.74
14.78
New Jersey
120
100.00
100.00
3,300
1.17
94.85
16.62
New Mexico
150
99.69
99.48
4,200
1.22
95.06
16.90
New York
160
98.84
96.79
4,500
1.23
92.27
20.02
North Carolina
160
100.00
100.00
4,800
1.24
94.19
14.17
North Dakota
270
99.86
99.19
3,700
2.56
95.57
9.78
Ohio
210
100.00
100.00
4,700
1.33
94.29
13.52
Oklahoma
140
100.00
100.00
3,600
1.85
94.35
13.95
Oregon
130
100.00
100.00
3,500
2.12
94.18
15.23
Pennsylvania
170
100.00
100.00
4,500
1.64
94.30
12.95
Rhode Island
120
100.00
100.00
3,400
1.12
94.98
15.17
South Carolina
120
100.00
100.00
3,200
1.08
96.08
11.87
South Dakota
190
100.00
100.00
3,400
1.42
95.36
10.56
Tennessee
120
100.00
100.00
3,400
1.34
94.21
13.54
Texas
310
100.00
100.00
9,200
1.65
95.36
17.92
Utah
120
99.08
99.32
3,600
1.25
94.79
12.66
Vermont
220
100.00
100.00
3,000
1.37
95.04
15.72
Virginia
110
100.00
100.00
3,300
1.51
94.35
13.07
Washington
120
99.09
99.35
3,600
2.17
93.50
14.12
West Virginia
150
100.00
100.00
3,200
1.71
94.77
10.03
Wisconsin
190
100.00
100.00
4,400
1.79
95.42
16.21
Wyoming
200
100.00
100.00
3,500
1.01
94.65
12.76
DoDEA2
120
99.23
98.08
3,700
1.66
95.05
12.20
Trial Urban (TUDA) Districts and Other Jurisdictions
Albuquerque
50
100.00
100.00
1,700
1.15
94.71
20.47
Atlanta
60
100.00
100.00
2,000
0.98
95.42
9.76
Austin
60
100.00
100.00
1,700
2.04
93.69
30.80
Baltimore City
70
100.00
100.00
1,600
1.59
94.32
19.27
Boston
80
100.00
100.00
2,000
3.69
93.72
19.59
Charlotte
50
100.00
100.00
1,700
1.19
94.18
12.81
Chicago
100
100.00
100.00
2,500
1.07
94.85
19.30
Cleveland
90
100.00
100.00
1,500
4.26
93.62
22.29
Dallas
50
100.00
100.00
1,700
2.33
95.79
35.42
Detroit
70
100.00
100.00
1,300
4.88
90.92
14.80
Fresno
50
100.00
100.00
1,800
0.90
93.58
7.51
Hillsborough
60
100.00
100.00
1,700
1.17
95.74
23.30
Houston
80
100.00
100.00
2,600
1.88
96.62
27.25
Jefferson County, KY
50 100.00 100.00 1,700 1.74 94.66 11.61
Los Angeles 80 100.00 100.00 2,500 1.96 95.80 9.83
Miami 90 100.00 100.00 2,300 2.35 95.07 28.05
Milwaukee 70 100.00 100.00 1,500 3.40 94.68 26.55
New York City
80 100.00 100.00 2,500 1.33 91.74 27.56
Philadelphia 60 100.00 100.00 1,600 3.45 94.71 15.82
San Diego 50 100.00 100.00 1,500 1.48 95.18 11.80
National
private
410
71.19
64.52
3,300
0.08
95.61
4.38
90 100.00 100.00 1,500 1.97 95.52 18.06
Catholic 130 88.65 89.70 1,700 0.06 95.60 4.95
Non-Catholic private
280 56.94 52.97 1,600 0.11 95.62 3.92
-
Puerto Rico
170
100.00
100.00
5,100
0.24
94.47
27.19
Includes national public, national private, and Bureau of Indian Education schools located in the United States and all Department of Defense Education Activity schools, but not schools in Puerto Rico.
Department of Defense Education Activity schools.
NOTE: Numbers of schools are rounded to nearest ten, and numbers of students are rounded to nearest hundred. Detail may not sum to totals because of rounding.
SOURCE: U.S. Department of Education, Institute of Education Sciences, National Center for Education Statistics, National Assessment of Educational Progress (NAEP), 2013 Mathematics Assessment.

National
all1
8,590
97.27
90.32
216,400
2.52
94.78
12.17
National
public
8,060
99.69
99.54
209,100
2.69
94.70
12.87
NAEP Technical Documentation Participation, Exclusion, and Accommodation Rates for Grade 4 Reading for the 2013 Assessment
The following table displays the school- and student-level response, exclusion, and accommodation rates for the grade 4 reading assessment by school type and jurisdiction. Various weights were used in the calculation of the rates, as indicated in the column headings of the table.
The participation rates reflect the participation of the original sample schools only and do not reflect any effect of substitution. The rates weighted by the base weight and enrollment show the approximate proportion of the student population in the jurisdiction that is represented by the responding schools in the sample. The rates weighted by just the base weight show the proportion of the school population that is represented by the responding schools in the sample. These rates differ because schools differ in size.
Participation, exclusion, and accommodation rates, grade 4 r eading assessment, by school type and jurisdiction: 2013
-
School
School
participation
participation
rates
rates
Number
(percent)
(percent)
Weighted
of
before
before
student
schools
substitution
substitution
Number
Weighted
participation
in
(weighted
(weighted
of
percent
rates
Weighted
School type
original
by base
by base
students
of
(percent)
percent of
and
sample,
weight and
weight
sampled,
students
after
students
jurisdiction
rounded
enrollment)
only)
rounded
excluded
makeups
accommodated
All
8,590
97.27
90.32
216,400
2.52
94.78
12.17
Northeast all
1,480
95.63
85.22
35,600
1.72
93.97
15.30
Midwest all
2,190
97.27
88.80
48,700
2.01
95.04
12.22
South all
2,740
98.20
93.44
76,000
3.39
95.00
12.25
West all
2,120
96.86
91.04
53,500
2.13
94.71
9.92
Alabama
120
100.00
100.00
3,400
1.14
95.49
5.39
Alaska
200
99.48
96.56
3,300
1.45
93.65
20.65
Arizona
120
100.00
100.00
3,500
1.08
95.46
13.24
Arkansas
120
100.00
100.00
3,600
1.11
95.16
15.34
California
300
99.17
98.75
9,300
2.50
94.88
7.73
Colorado
120
100.00
100.00
3,500
1.52
93.66
12.61
Connecticut
120
97.22
97.25
3,400
1.58
94.29
15.33
Delaware
100
100.00
100.00
3,500
4.70
94.34
10.38
District of Columbia
140
100.00
100.00
2,400
1.65
94.46
17.41
Florida
240
100.00
100.00
7,100
2.96
93.98
19.02
Georgia
170
100.00
100.00
5,400
4.90
95.34
8.13
Hawaii
120
100.00
100.00
3,600
1.80
93.97
10.48
Idaho
130
100.00
100.00
3,600
1.49
94.99
9.32
Illinois
200
97.98
98.40
5,200
1.24
95.13
14.76
Indiana
120
100.00
100.00
3,500
2.43
94.40
16.31
Iowa
140
100.00
100.00
3,200
1.08
95.11
14.42
Kansas
150
100.00
100.00
3,500
1.82
95.07
13.41
Kentucky
160
100.00
100.00
4,800
2.99
94.97
9.74
Louisiana
130
100.00
100.00
3,400
1.16
94.73
18.61
Maine
160
100.00
100.00
3,500
1.69
93.65
17.87
Maryland
170
100.00
100.00
4,900
12.86
94.40
5.70
Massachusetts
190
100.00
100.00
5,300
2.66
93.77
15.53
Michigan
190
100.00
100.00
4,800
3.81
94.64
9.66
Minnesota
130
100.00
100.00
3,600
2.71
94.93
9.61
Mississippi
120
100.00
100.00
3,400
0.53
94.99
6.85
Missouri
130
100.00
100.00
3,700
1.23
95.26
11.16
Montana
200
99.85
98.28
3,500
2.86
94.40
7.33
Nebraska
170
100.00
100.00
3,600
3.57
95.83
14.26
Nevada
120
100.00
100.00
3,700
1.50
95.10
22.73
New Hampshire
130
100.00
100.00
3,500
2.56
93.45
13.48
New Jersey
120
100.00
100.00
3,400
1.72
94.87
15.27
New Mexico
150
99.69
99.48
4,300
1.02
94.55
15.04
New York
160
98.84
96.79
4,600
1.35
93.06
20.15
North Carolina
160
100.00
100.00
5,000
1.80
94.88
13.06
North Dakota
270
99.86
99.19
3,800
4.06
96.28
8.73
Ohio
210
100.00
100.00
4,800
2.61
94.58
12.80
Oklahoma
140
100.00
100.00
3,700
1.72
94.58
14.35
Oregon
130
100.00
100.00
3,700
2.49
93.98
12.20
Pennsylvania
170
100.00
100.00
4,600
2.29
94.42
12.53
Rhode Island
120
100.00
100.00
3,500
1.34
94.78
14.43
South Carolina
120
100.00
100.00
3,300
1.73
94.64
9.74
South Dakota
190
100.00
100.00
3,500
2.22
95.69
9.26
Tennessee
120
100.00
100.00
3,500
3.10
95.34
12.29
Texas
310
100.00
100.00
9,500
4.90
95.50
14.40
Utah
120
99.08
99.32
3,700
3.05
93.71
10.29
Vermont
220
100.00
100.00
3,100
1.17
95.05
15.65
Virginia
110
100.00
100.00
3,400
1.54
94.93
12.21
Washington
120
99.09
99.35
3,700
2.81
93.71
12.45
West Virginia
150
100.00
100.00
3,300
1.78
93.62
8.89
Wisconsin
190
100.00
100.00
4,500
1.61
94.97
16.63
Wyoming
200
100.00
100.00
3,600
1.25
94.38
13.00
DoDEA2
120
99.23
98.08
3,800
5.95
95.48
7.39
Trial Urban (TUDA) Districts and Other Jurisdictions
Albuquerque
50
100.00
100.00
1,800
0.74
93.43
17.51
Atlanta
60
100.00
100.00
2,000
1.12
95.96
9.39
Austin
60
100.00
100.00
1,700
3.90
94.12
27.06
Baltimore City
70
100.00
100.00
1,700
15.85
93.62
4.33
Boston
80
100.00
100.00
2,000
4.33
94.03
17.64
Charlotte
50
100.00
100.00
1,700
0.90
94.49
11.72
Chicago
100
100.00
100.00
2,600
1.45
94.58
18.56
Cleveland
90
100.00
100.00
1,500
4.70
94.08
22.22
Dallas
50
100.00
100.00
1,700
17.11
96.08
24.30
Detroit
70
100.00
100.00
1,300
5.51
92.09
13.44
Fresno
50
100.00
100.00
1,800
2.36
94.94
6.04
Hillsborough
60
100.00
100.00
1,800
1.07
94.92
23.00
Houston
80
100.00
100.00
2,700
6.41
96.63
23.90
Jefferson County, KY
50
100.00
100.00
1,800
5.28
95.03
7.56
Los Angeles
80
100.00
100.00
2,500
2.10
94.63
10.75
Miami
90
100.00
100.00
2,400
4.51
95.37
26.36
Milwaukee
70
100.00
100.00
1,500
4.08
93.65
25.71
New York City
80
100.00
100.00
2,500
1.62
92.44
27.13
-
Philadelphia
60
100.00
100.00
1,600
3.83
94.61
15.31
San Diego
50
100.00
100.00
1,600
2.32
94.74
10.45
District of Columbia (TUDA)
90
100.00
100.00
1,600
2.26
94.50
17.21
Catholic
130
88.65
89.70
1,700
0.23
95.75
3.84
Non-Catholic private
280
56.94
52.97
1,600
0.79
95.96
4.22
Includes national public, national private, and Bureau of Indian Education schools located in the United States and all Department of Defense Education Activity schools, but not schools in Puerto Rico.
Department of Defense Education Activity schools.
NOTE: Numbers of schools are rounded to nearest ten, and numbers of students are rounded to nearest hundred. Detail may not sum to totals because of rounding.
SOURCE: U.S. Department of Education, Institute of Education Sciences, National Center for Education Statistics, National Assessment of Educational Progress (NAEP), 2013 Reading Assessment.
National
private
410
71.19
64.52
3,400
0.53
95.85
4.05

National
all1
7,240
96.94
84.59
195,600
1.48
93.15
11.79
National
public
6,760
99.48
99.61
189,400
1.59
93.02
12.25
NAEP Technical Documentation Participation, Exclusion, and Accommodation Rates for Grade 8 Mathematics for the 2013 Assessment
The following table displays the school- and student-level response, exclusion, and accommodation rates for the grade 8 mathematics assessment by school type and jurisdiction. Various weights were used in the calculation of the rates, as indicated in the column headings of the table.
The participation rates reflect the participation of the original sample schools only and do not reflect any effect of substitution. The rates weighted by the base weight and enrollment show the approximate proportion of the student population in the jurisdiction that is represented by the responding schools in the sample. The rates weighted by just the base weight show the proportion of the school population that is represented by the responding schools in the sample. These rates differ because schools differ in size.
Participation, exclusion, and accommodation rates, grade 8 mathematics assessment, by school type and jurisdiction: 2013
-
School
School
participation
participation
rates
rates
Number
(percent)
(percent)
Weighted
of
before
before
student
schools
substitution
substitution
Number
Weighted
participation
in
(weighted
(weighted
of
percent
rates
Weighted
School type
original
by base
by base
students
of
(percent)
percent of
and
sample,
weight and
weight
sampled,
students
after
students
jurisdiction
rounded
enrollment)
only)
rounded
excluded
makeups
accommodated
All
7,370
96.97
84.74
201,500
1.47
93.14
11.88
Northeast all
1,160
93.53
75.06
32,700
1.60
92.00
15.85
Midwest all
1,920
97.62
85.21
44,100
1.42
93.69
11.78
South all
2,380
97.75
86.70
68,800
1.51
93.24
11.59
West all
1,720
97.42
89.08
48,000
1.41
93.28
9.25
Alabama
110
100.00
100.00
3,000
1.04
94.23
5.14
Alaska
150
99.91
98.79
3,000
1.08
91.72
18.75
Arizona
120
99.03
99.16
3,200
1.30
93.42
10.71
Arkansas
110
100.00
100.00
3,200
1.93
95.00
13.92
California
260
100.00
100.00
8,400
1.49
93.59
7.91
Colorado
120
100.00
100.00
3,100
1.12
93.47
11.50
Connecticut
110
98.00
97.87
3,100
2.05
92.44
13.92
Delaware
70
100.00
100.00
3,200
1.31
90.65
14.90
District of Columbia
90
100.00
100.00
2,100
0.96
91.26
20.71
Florida
230
100.00
100.00
6,400
1.70
91.06
15.32
Georgia
130
100.00
100.00
4,800
1.55
93.38
9.82
Hawaii
60
100.00
100.00
3,200
1.67
90.26
12.28
Idaho
100
100.00
100.00
3,100
1.06
94.15
8.42
Illinois
190
100.00
100.00
4,800
1.01
94.48
13.83
Indiana
110
97.06
96.65
3,000
1.64
92.49
13.95
Iowa
120
100.00
100.00
3,100
0.77
93.74
13.28
Kansas
130
100.00
100.00
3,300
1.67
93.94
11.23
Kentucky
140
99.04
99.21
4,300
2.08
94.54
10.09
Louisiana
150
100.00
100.00
3,200
1.06
94.14
14.26
Maine
120
100.00
100.00
2,900
1.33
92.79
15.99
Maryland
160
100.00
100.00
4,400
1.74
92.08
13.33
Massachusetts
140
100.00
100.00
4,800
2.01
91.98
16.11
Michigan
170
100.00
100.00
4,200
2.46
92.93
10.55
Minnesota
130
98.99
99.67
2,900
1.70
91.58
9.16
Mississippi
110
100.00
100.00
3,200
0.80
93.80
6.51
Missouri
130
100.00
100.00
3,100
1.28
94.25
10.57
Montana
150
99.80
98.82
3,200
1.44
92.28
9.20
Nebraska
130
100.00
100.00
3,100
1.85
93.41
12.02
Nevada
90
100.00
100.00
3,300
1.04
92.80
11.91
New Hampshire
90
100.00
100.00
3,200
1.06
91.60
15.99
New Jersey
110
100.00
100.00
3,100
1.64
92.26
16.38
New Mexico
120
99.68
99.02
4,000
1.57
93.07
12.00
New York
160
93.08
95.81
4,300
1.90
91.15
19.38
North Carolina
140
100.00
100.00
4,500
1.29
92.95
13.74
North Dakota
190
99.92
99.44
3,700
2.93
94.98
11.44
Ohio
200
100.00
100.00
4,500
1.51
93.07
13.54
Oklahoma
130
100.00
100.00
3,100
1.63
92.97
14.09
Oregon
130
100.00
100.00
3,100
1.47
92.91
10.88
Pennsylvania
160
100.00
100.00
4,300
1.70
92.17
14.66
Rhode Island
60
100.00
100.00
3,200
1.11
93.93
15.92
South Carolina
110
100.00
100.00
3,200
1.33
94.19
9.86
South Dakota
150
100.00
100.00
3,200
1.30
94.44
8.66
Tennessee
110
100.00
100.00
3,200
1.77
92.81
9.81
Texas
230
100.00
100.00
8,800
1.92
93.82
12.13
Utah
120
100.00
100.00
3,300
1.53
92.07
10.15
Vermont
120
100.00
100.00
3,000
0.83
93.91
15.36
Virginia
110
100.00
100.00
3,200
1.05
93.39
12.18
Washington
120
100.00
100.00
3,100
2.03
90.87
11.47
West Virginia
110
100.00
100.00
3,200
1.69
92.62
9.02
Wisconsin
170
100.00
100.00
4,300
1.51
94.25
14.73
Wyoming
100
100.00
100.00
3,300
1.50
93.66
12.51
DoDEA2
70
99.40
96.83
2,600
1.15
94.47
9.23
Trial Urban (TUDA) Districts and Other Jurisdictions
Albuquerque
30
100.00
100.00
1,400
1.53
90.76
14.44
Atlanta
30
100.00
100.00
1,600
0.72
91.57
11.10
Austin
30
100.00
100.00
1,600
1.88
90.97
20.60
Baltimore City
60
100.00
100.00
1,300
1.70
89.54
19.73
Boston
40
100.00
100.00
1,800
2.55
91.61
20.88
Charlotte
40
100.00
100.00
1,500
1.29
90.94
10.11
Chicago
100
100.00
100.00
2,300
1.28
94.80
17.19
Cleveland
90
100.00
100.00
1,500
2.62
91.57
28.48
Dallas
40
100.00
100.00
1,600
2.44
93.81
18.35
Detroit
50
100.00
100.00
1,100
4.29
91.58
15.07
Fresno
20
100.00
100.00
1,400
1.74
92.52
7.06
Hillsborough
50
100.00
100.00
1,600
1.35
93.78
20.46
Houston
50
100.00
100.00
2,400
2.21
92.37
14.67
Jefferson County, KY
40
100.00
100.00
1,600
1.65
93.37
12.72
Los Angeles
70
100.00
100.00
2,200
1.54
94.39
10.83
Miami
80
100.00
100.00
2,300
2.25
92.63
18.78
Milwaukee
60
100.00
100.00
1,500
4.10
91.60
25.55
New York City
90 99.00 97.58 2,400 1.72 91.78 26.10
Philadelphia 50 100.00 100.00 1,400 3.74 92.67 20.69
San Diego 30 100.00 100.00 1,300 2.32 92.60 11.81
National
private
400
69.63
60.45
3,400
0.26
94.74
6.54
40 100.00 100.00 1,100 1.69 90.15 22.20
Catholic 130 87.18 84.76 1,800 0.26 95.73 5.50
Non-Catholic private
270 53.51 48.11 1,600 0.26 93.50 7.51
-
Puerto Rico
130
100.00
100.00
5,900
0.03
92.75
23.05
Includes national public, national private, and Bureau of Indian Education schools located in the United States and all Department of Defense Education Activity schools, but not schools in Puerto Rico.
Department of Defense Education Activity schools.
NOTE: Numbers of schools are rounded to nearest ten, and numbers of students are rounded to nearest hundred. Detail may not sum to totals because of rounding.
SOURCE: U.S. Department of Education, Institute of Education Sciences, National Center for Education Statistics, National Assessment of Educational Progress (NAEP), 2013 Mathematics Assessment.
National
all1
7,240
96.94
84.59
199,100
2.15
93.11
10.76
National
public
6,760
99.48
99.61
192,900
2.32
92.93
11.16
NAEP Technical Documentation Participation, Exclusion, and Accommodation Rates for Grade 8 Reading for the 2013 Assessment
The following table displays the school- and student-level response, exclusion, and accommodation rates for the grade 8 reading assessment by school type and jurisdiction. Various weights were used in the calculation of the rates, as indicated in the column headings of the table.
The participation rates reflect the participation of the original sample schools only and do not reflect any effect of substitution. The rates weighted by the base weight and enrollment show the approximate proportion of the student population in the jurisdiction that is represented by the responding schools in the sample. The rates weighted by just the base weight show the proportion of the school population that is represented by the responding schools in the sample. These rates differ because schools differ in size.
Participation, exclusion, and accommodation rates, grade 8 r eading assessment, by school type and jurisdiction: 2013
-
School
School
participation
participation
rates
rates
Number
(percent)
(percent)
Weighted
of
before
before
student
schools
substitution
substitution
Number
Weighted
participation
in
(weighted
(weighted
of
percent
rates
Weighted
School type
original
by base
by base
students
of
(percent)
percent of
and
sample,
weight and
weight
sampled,
students
after
students
jurisdiction
rounded
enrollment)
only)
rounded
excluded
makeups
accommodated
All
7,240
96.94
84.59
199,100
2.15
93.11
10.76
Northeast all
1,160
93.53
75.06
33,300
1.55
91.80
15.53
Midwest all
1,920
97.62
85.21
45,100
1.93
93.48
11.08
South all
2,380
97.75
86.70
69,900
2.60
93.39
9.99
West all
1,720
97.42
89.08
48,900
2.08
93.21
8.32
Alabama
110
100.00
100.00
3,100
1.14
94.26
4.83
Alaska
150
99.91
98.79
3,100
1.40
91.91
18.39
Arizona
120
99.03
99.16
3,300
1.47
93.67
9.67
Arkansas
110
100.00
100.00
3,200
1.96
93.21
13.36
California
260
100.00
100.00
8,500
2.52
93.42
6.74
Colorado
120
100.00
100.00
3,200
1.15
93.46
10.89
Connecticut
110
98.00
97.87
3,100
2.13
91.38
13.88
Delaware
70
100.00
100.00
3,200
3.49
91.59
12.23
District of Columbia
90
100.00
100.00
2,100
1.82
91.33
19.57
Florida
230
100.00
100.00
6,500
1.86
91.72
15.15
Georgia
130
100.00
100.00
4,900
3.80
93.67
8.18
Hawaii
60
100.00
100.00
3,300
1.93
90.58
12.33
Idaho
100
100.00
100.00
3,200
1.61
93.64
7.76
Illinois
190
100.00
100.00
4,900
1.44
93.76
12.94
Indiana
110
97.06
96.65
3,100
1.90
93.12
13.75
Iowa
120
100.00
100.00
3,100
1.27
93.44
12.16
Kansas
130
100.00
100.00
3,300
1.72
93.42
11.72
Kentucky
140
99.04
99.21
4,300
3.28
93.93
8.47
Louisiana
150
100.00
100.00
3,300
1.24
93.78
14.15
Maine
120
100.00
100.00
3,000
1.55
92.34
15.16
Maryland
160
100.00
100.00
4,400
9.41
93.77
5.45
Massachusetts
140
100.00
100.00
4,900
2.15
91.82
15.04
Michigan
170
100.00
100.00
4,300
3.53
93.66
9.68
Minnesota
130
98.99
99.67
3,000
2.33
91.30
8.43
Mississippi
110
100.00
100.00
3,200
0.70
93.72
6.55
Missouri
130
100.00
100.00
3,100
1.02
92.55
10.62
Montana
150
99.80
98.82
3,200
2.29
91.61
7.51
Nebraska
130
100.00
100.00
3,200
2.99
92.32
10.14
Nevada
90
100.00
100.00
3,400
1.00
92.19
10.91
New Hampshire
90
100.00
100.00
3,200
2.93
91.46
14.28
New Jersey
110
100.00
100.00
3,200
2.64
92.01
14.78
New Mexico
120
99.68
99.02
4,000
1.70
93.39
10.00
New York
160
93.08
95.81
4,400
0.96
90.46
20.03
North Carolina
140
100.00
100.00
4,600
1.72
92.51
12.29
North Dakota
190
99.92
99.44
3,800
4.30
94.07
9.52
Ohio
200
100.00
100.00
4,600
2.22
93.08
13.08
Oklahoma
130
100.00
100.00
3,200
1.39
93.43
12.42
Oregon
130
100.00
100.00
3,200
1.45
92.62
11.30
Pennsylvania
160
100.00
100.00
4,300
1.78
91.94
14.51
Rhode Island
60
100.00
100.00
3,300
1.37
92.96
15.18
South Carolina
110
100.00
100.00
3,200
1.88
94.03
7.48
South Dakota
150
100.00
100.00
3,300
2.95
95.01
6.02
Tennessee
110
100.00
100.00
3,200
3.13
93.54
7.75
Texas
230
100.00
100.00
8,900
3.51
93.78
10.05
Utah
120
100.00
100.00
3,400
3.05
93.00
8.36
Vermont
120
100.00
100.00
3,100
0.92
92.93
15.08
Virginia
110
100.00
100.00
3,300
1.40
92.97
10.56
Washington
120
100.00
100.00
3,200
2.46
91.22
9.78
West Virginia
110
100.00
100.00
3,200
1.82
93.10
7.60
Wisconsin
170
100.00
100.00
4,400
1.61
94.11
14.45
Wyoming
100
100.00
100.00
3,400
1.14
93.15
12.27
DoDEA2
70
99.40
96.83
2,600
3.84
94.13
7.11
Trial Urban (TUDA) Districts and Other Jurisdictions
Albuquerque
30
100.00
100.00
1,400
2.04
93.46
11.79
Atlanta
30
100.00
100.00
1,700
1.02
92.20
10.98
Austin
30
100.00
100.00
1,600
3.35
88.54
18.36
Baltimore City
60
100.00
100.00
1,300
16.39
89.73
5.14
Boston
40
100.00
100.00
1,800
3.41
93.05
18.94
Charlotte
40
100.00
100.00
1,500
1.68
92.20
9.90
Chicago
100
100.00
100.00
2,300
1.60
94.72
16.76
Cleveland
90
100.00
100.00
1,500
3.52
91.90
27.75
Dallas
40
100.00
100.00
1,600
3.51
93.98
15.20
Detroit
50
100.00
100.00
1,100
5.74
91.37
12.53
Fresno
20
100.00
100.00
1,500
3.10
93.27
5.86
Hillsborough
50
100.00
100.00
1,600
1.94
91.85
19.74
Houston
50
100.00
100.00
2,400
3.80
93.58
12.29
Jefferson County, KY
40
100.00
100.00
1,600
4.30
94.71
9.49
Los Angeles
70
100.00
100.00
2,300
2.70
94.30
9.97
Miami
80
100.00
100.00
2,400
2.88
94.21
18.45
Milwaukee
60
100.00
100.00
1,500
4.06
93.15
25.08
New York City
90
99.00
97.58
2,400
1.46
91.17
26.00
-
Philadelphia
50
100.00
100.00
1,400
3.79
91.35
20.91
San Diego
30
100.00
100.00
1,300
2.58
93.78
10.58
District of Columbia (TUDA)
40
100.00
100.00
1,100
2.53
90.18
22.13
Catholic
130
87.18
84.76
1,900
0.21
96.07
4.96
Non-Catholic private
270
53.51
48.11
1,600
0.39
94.67
7.56
Includes national public, national private, and Bureau of Indian Education schools located in the United States and all Department of Defense Education Activity schools, but not schools in Puerto Rico.
Department of Defense Education Activity schools.
NOTE: Numbers of schools are rounded to nearest ten, and numbers of students are rounded to nearest hundred. Detail may not sum to totals because of rounding.
SOURCE: U.S. Department of Education, Institute of Education Sciences, National Center for Education Statistics, National Assessment of Educational Progress (NAEP), 2013 Reading Assessment.
National
private
400
69.63
60.45
3,500
0.30
95.45
6.32
NAEP Technical Documentation Website
NAEP Technical Documentation Participation, Exclusion, and Accommodation Rates for Grade 12 Mathematics for the 2013 Assessment
The following table displays the school- and student-level response, exclusion, and accommodation rates for the grade 12 mathematics assessment. Various weights were used in the calculation of the rates, as indicated in the column headings of the table.
The participation rates reflect the participation of the original sample schools only and do not reflect any effect of substitution. The rates weighted by the base weight and enrollment show the approximate proportion of the student population in the jurisdiction that is represented by the responding schools in the sample. The rates weighted by just the base weight show the proportion of the school population that is represented by the responding schools in the sample. These rates differ because schools differ in size.
National
all1
2,200
89.51
82.66
62,200
2.16
84.33
8.65
National
public
2,030
92.95
93.31
60,400
2.31
84.17
8.77 

-
School
School
participation
participation
rates
Weighted
Number
rates (percent)
(percent)
student
of
before
before
participation
schools
substitution
substitution
Number
Weighted
rates
Weighted
in
(weighted by
(weighted by
of
percentage
(percent)
percentage of
School type and geographic
original
base weight
base weight
students
of students
after
students
region
sample
and enrollment)
only)
sampled
excluded
makeups
accommodated
All
2,200
89.51
82.66
62,200
2.16
84.33
8.65
Northeast all
510
89.05
81.63
16,200
2.29
81.79
11.95
Midwest all
650
87.14
83.20
16,600
1.65
83.87
8.61
South all
710
89.42
85.99
20,300
2.31
86.52
7.98
West all
330
92.21
77.24
9,100
2.32
83.37
7.15
Arkansas
100
100.00
100.00
2,900
2.78
92.09
8.61
Connecticut
110
98.93
99.45
3,200
1.76
81.22
8.71
Florida
120
99.05
99.30
3,300
3.21
77.25
12.67
Idaho
100
100.00
100.00
3,000
1.65
89.17
6.72
Illinois
130
90.38
93.98
3,300
1.85
85.16
9.79
Iowa
120
100.00
100.00
3,300
1.13
83.05
10.78
Massachusetts
110
99.04
99.45
3,200
2.21
81.71
11.13
Michigan
140
100.00
100.00
4,000
1.90
86.94
8.78
New Hampshire
80
100.00
100.00
4,100
1.61
76.64
11.22
New Jersey
110
98.14
98.57
3,300
1.89
84.10
14.28
South Dakota
140
99.74
99.07
3,100
1.51
87.48
5.78
Tennessee
130
100.00
100.00
4,100
2.51
88.15
7.84
West Virginia
90
100.00
100.00
3,300
2.00
83.68
7.01
Remaining jurisdictions2
570
91.16
90.91
16,200
2.26
84.41
10.55
Catholic
40
68.06
79.95
1,000
0.83
85.53
5.46
Non-Catholic private
120
38.52
50.25
800
0.42
87.96
9.28
Includes national public, national private, Bureau of Indian Education, and Department of Defense Education Activity schools located in the United States.
Includes national public schools not part of the state assessment.
NOTE: Numbers of schools are rounded to nearest ten, and numbers of students are rounded to nearest hundred. Detail may not sum to totals because of rounding.
SOURCE: U.S. Department of Education, Institute of Education Sciences, National Center for Education Statistics, National Assessment of Educational Progress (NAEP), 2013 Mathematics Assessment.
National
private
160
53.34
55.43
1,800
0.63
86.51
7.32

NAEP Technical Documentation Website
NAEP Technical Documentation Participation, Exclusion, and Accommodation Rates for Grade 12 Reading for the 2013 Assessment
The following table displays the school- and student-level response, exclusion, and accommodation rates for the grade 12 reading assessment. Various weights were used in the calculation of the rates, as indicated in the column headings of the table.
The participation rates reflect the participation of the original sample schools only and do not reflect any effect of substitution. The rates weighted by the base weight and enrollment show the approximate proportion of the student population in the jurisdiction that is represented by the responding schools in the sample. The rates weighted by just the base weight show the proportion of the school population that is represented by the responding schools in the sample. These rates differ because schools differ in size.
National
public
2,030
92.95
93.31
60,400
2.56
83.77
8.73 
-
School
Weighted
Number
participation rates
School
student
of
(percent) before
participation rates
participation
schools
substitution
(percent) before
Number
Weighted
rates
Weighted
in
(weighted by base
substitution
of
percentage
(percent)
percentage of
School type and
original
weight and
(weighted by
students
of students
after
students
geographic region
sample
enrollment)
base weight only)
sampled
excluded
makeups
accommodated
All
2,200
89.51
82.66
62,300
2.41
83.89
8.55
National all1
2,200
89.51
82.66
62,300
2.41
83.89
8.55
Northeast all
510
89.05
81.63
16,500
2.16
80.91
12.89
Midwest all
650
87.14
83.20
16,700
2.05
84.05
8.75
South all
710
89.42
85.99
20,000
2.87
85.51
7.18
West all
330
92.21
77.24
9,000
2.24
83.58
7.14
Arkansas
100
100.00
100.00
3,000
2.56
90.21
8.24
Connecticut
110
98.93
99.45
3,400
2.34
79.77
8.70
Florida
120
99.05
99.30
3,300
3.55
77.34
12.14
Idaho
100
100.00
100.00
3,200
1.66
88.68
6.42
Illinois
130
90.38
93.98
3,400
2.29
83.72
9.92
Iowa
120
100.00
100.00
3,500
1.51
84.26
10.62
Massachusetts
110
99.04
99.45
3,200
1.87
79.84
11.31
Michigan
140
100.00
100.00
3,900
4.01
87.21
6.17
New Hampshire
80
100.00
100.00
4,300
2.55
76.91
10.25
New Jersey
110
98.14
98.57
3,300
1.80
84.67
14.78
South Dakota
140
99.74
99.07
3,300
1.60
86.17
5.16
Tennessee
130
100.00
100.00
3,900
2.88
88.82
7.13
West Virginia
90
100.00
100.00
3,400
2.37
84.28
6.89
Remaining jurisdictions2
570
91.16
90.91
15,200
2.77
83.98
10.05
Catholic
40
68.06
79.95
1,100
0.92
84.67
4.01
Non-Catholic
120
38.52
50.25
800
0.75
86.75
9.41
Includes national public, national private, Bureau of Indian Education, and Department of Defense Education Activity schools located in the United States.
Includes national public schools not part of the state assessment.
NOTE: Numbers of schools are rounded to nearest ten, and numbers of students are rounded to nearest hundred. Detail may not sum to totals because of rounding.
SOURCE: U.S. Department of Education, Institute of Education Sciences, National Center for Education Statistics, National Assessment of Educational Progress (NAEP), 2013 Reading Assessment.
National
private
160
53.34
55.43
1,900
0.84
85.52
6.67

NAEP Technical Documentation Website
NAEP Technical Documentation Nonresponse Bias Analyses for the 2013 Assessment
NCES statistical standards call for a nonresponse bias analysis to be conducted for a sample with a response rate below 85 percent at any stage of sampling. Weighted school response rates for the 2013 assessment indicated a need for school nonresponse bias analyses for private school samples in grades 4, 8, and 12 (operational subjects). Student nonresponse bias analyses were necessary for the grade 12 public school student sample overall and in specific states, for both reading and mathematics: Connecticut, Florida, Iowa, Massachusetts, New Hampshire, and West Virginia. Additionally, a student nonresponse bias analysis was required for the grade 12 public school student sample in Illinois based on the weighted response rate for reading, while such an analysis was required for grade 12 public school student sample in New Jersey based on the weighted response rate for mathematics. Thus, three separate school-level analyses and nine separate student-level analyses were conducted.
The procedures and results from these analyses are summarized briefly
below. The analyses conducted consider
only certain
characteristics of
schools and
students. They
do not
directly consider
the effects
of the nonresponse on student achievement, the primary focus
of NAEP. Thus, these
analyses cannot be conclusive of either the existence or absence of
nonresponse bias for student achievement. For more details,
please see
the NAEP
2013 NRBA
report
![]() (657.56 KB).
(657.56 KB).
Each school-level analysis was conducted in three parts. The first part of the analysis looked
for potential nonresponse bias that was introduced through school nonresponse. The second part of the analysis examined the remaining potential for nonresponse bias after accounting for the mitigating effects of substitution. The third part of the analysis examined the remaining potential for nonresponse bias after accounting for the mitigating effects of both school substitution and school-level nonresponse weight adjustments. The characteristics examined were Census region, reporting subgroup (private school type), urban-centric locale, size of school (categorical), and race/ethnicity percentages (mean).
Based on the school characteristics available, for the private school samples at grade 4, there does not appear to be evidence of substantial potential bias resulting from school substitution or school nonresponse. However, the analyses suggest that a potential for nonresponse bias remains for the grade 8 and 12 private school samples. For grade 8, this result is evidently related to the fact that, among non- Catholic schools, larger schools were less likely to respond. Thus, when making adjustments to address the underrepresentation of non-Catholic schools among the respondents, the result is to over
represent smaller schools at the expense of larger ones. The limited school sample sizes involved means that it is not possible to make adjustments that account fully for all school characteristics. For grade 12, the analyses suggested potential bias for percentage Asian and percentage Two or more races. Please see the full report for more details.
Each student-level analysis was conducted in two parts. The first part of the analysis examined the potential for nonresponse bias that was introduced through student nonresponse. The second part of the analysis examined the potential for bias after accounting for the effects of nonresponse weight adjustments. The characteristics examined were gender, race/ethnicity, relative age, National School Lunch Program eligibility, student disability (SD) status, and English language learner (ELL) status.
Based on the student characteristics available, there does not appear to be evidence of substantial potential bias resulting from student nonresponse. Please see the full report for more details.

Appendix C
NATIONAL CENTER FOR EDUCATION STATISTICS NATIONAL ASSESSMENT OF EDUCATIONAL PROGRESS
National Assessment of Educational Progress (NAEP)
2021
Appendix C
2021 Sampling Memo
OMB# 1850-0928 v.22
March 2021
No changes since v. 21
Will be updated in v. 23
.

-
Date:
September 25, 2020
Memo: 2021-1.2S/1.2D
To:
William Ward, NCES Ed Kulick, ETS
David Freund, ETS Amy Dresher, ETS Cathy White, Pearson Greg Binzer
Lauren Byrne Lisa Rodriguez Rick Rogers
Rob Dymowski
Chris Averett
Kavemuii Murangi
Dwight Brock
Jill DeMatteis
Jing Kang Yiting Long
William Wall
Leslie Wallace
Natalia Weil
Sabrina Zhang
From:
Amy Lin, John Burke, and Lloyd Hicks
Reviewer:
Keith Rust
Subject:
Sample Design for 2021 NAEP - FINAL
Comment:
This memorandum has been revised to reflect the substantial changes in the 2021 NAEP sample design due to the anticipated greater costs and complexity of administration in the COVID-19 environment. The sample sizes for each state sample have been halved, the Trial Urban District Assessment (TUDA) as well as the national US history and civics assessments have been canceled, and the three-block study has been postponed.
Introduction
For 2021, the NAEP assessment involves the following components:
National assessments in reading and mathematics in public and private schools at grades 4 and 8;
State-by-state assessments in reading and mathematics for public schools at grades 4 and 8;
An assessment of mathematics in Puerto Rico for public schools at grades 4 and 8; Below is a summary list of the features of the 2021 sample design.
The sample sizes for the public-school state-by-state assessments are significantly smaller than those from prior years involving state-level reporting due to increased costs associated with administering assessments during the current pandemic. This sampling plan refers to these samples as the sigma samples to distinguish them from the traditional alpha samples. The sigma state samples are half the size of the corresponding alpha samples.
The sample sizes for the private school assessments are relatively the same as those from past years involving state-level reporting for public schools.
The sigma samples for grades 4 and 8 public, and the delta samples for private schools at grades 4 and 8, will be used for the operational assessments in reading and mathematics.
The reading and mathematics assessments will be administered in digital form (DBA) using tablets.
Because of the significant reduction of the state sample sizes and the cancellation of the TUDA assessments, the school sample sizes for the sigma samples in each state are considerably smaller than in 2019 and past assessments involving state-level reporting. This can be seen by comparing the figures in Tables 1 and 3, with comparable tables from previous assessments. This also means that there are fewer schools with multiple assessment sessions assigned.
In the sigma sample at grade 4, there are 24 schools with a student sample size twice the usual student sample size, and 5 schools with a student sample size at least three times the usual student sample size. This compares with comparable counts of 234 and 38 schools in 2019. At grade 8, there are 53 schools with a double-size student sample, and 10 schools with a student sample size at least three times more than the usual student sample size. This compares with comparable counts of 588 and 336 schools in 2019.
The stratification for the public-school samples includes separate strata for the TUDA school districts. This is because at the time at which it was necessary to finalize the stratification, the TUDA study had not yet been cancelled.
There are no samples in U.S. territories other than for Puerto Rico at grades 4 and 8.
For 2021, the Department of Defense Schools (DoDEA) jurisdiction consists only of the DoDEA Americas schools.
There is no National Indian Education Study. This means that less extensive sampling of Bureau of Indian Education (BIE) schools is required than in 2019 and other years when NIES has been conducted. To ensure sound results for American Indian and Alaska Native (AIAN) students in reading and mathematics at the national level, at grades 4 and 8 BIE students were sampled at the same rate as students in Oklahoma, the state with the highest proportion AIAN population.
The sampling rates of private schools at grades 4 and 8 are similar to those of 2019. Response rates permitting, this will allow separate reporting for reading and mathematics for Catholic and non-Catholic schools at grades 4 and 8, but no further breakdowns by private school type.
The sample sizes of assessed students for these various components are shown in Table 1 (which also shows the approximate numbers of participating schools).
Table 1. Target sample sizes of assessed students, and expected number of participating schools, for 2021 NAEP
|
Spiral |
Jurisdictions |
Students |
Total |
||
Spiral Indic. |
States (incl. DC, DoDEA) |
Urban districts |
Public school students |
Private school students |
||
Grade 4 |
|
|
|
|
|
|
Nat’l/state reading |
DS |
52 |
0 |
45,500 |
2,350 |
47,850 |
Nat’l/state math |
DS |
52 |
0 |
45,500 |
2,350 |
47,850 |
Puerto Rico |
DP |
1 |
|
3,000 |
|
3,000 |
Total - sigma |
|
|
|
94,000 |
|
94,000 |
Total- delta |
|
|
|
|
4,700 |
4,700 |
Typical max. no. students/school |
|
|
|
50 |
50 |
|
Average assessed students/school |
|
|
|
38 |
22 |
|
Total schools - sigma, delta |
|
|
|
2,450 |
215 |
2,665 |
|
|
|
|
|
|
|
Total number of students grade 4 |
|
|
|
94,000 |
4,700 |
98,700 |
Total number of schools grade 4 |
|
|
|
2,450 |
215 |
2,665 |
Table 1. Target sample sizes of assessed students, and expected number of participating schools, for 2021 NAEP (Continued)
|
Spiral |
Jurisdictions |
Students |
Total |
||
Spiral Indic. |
States (incl. DC, DoDEA) |
Urban districts |
Public school students |
Private school students |
||
Grade 8 |
|
|
|
|
|
|
Nat’l/state reading |
DS |
52 |
0 |
45,500 |
2,350 |
47,750 |
Nat’l/state math |
DS |
52 |
0 |
45,500 |
2,350 |
47,750 |
Puerto Rico |
DP |
1 |
|
3,000 |
|
3,000 |
Total - sigma |
|
|
|
94,000 |
|
94,000 |
Total- delta |
|
|
|
|
4,700 |
4,500 |
Typical max. no. students/school |
|
|
|
50 |
50 |
|
Average assessed students/school |
|
|
|
40 |
24 |
|
Total schools - sigma, delta |
|
|
|
2,350 |
195 |
2,545 |
|
|
|
|
|
|
|
Total number of students grade 8 |
|
|
|
94,000 |
4,700 |
98,700 |
Total number of schools grade 8 |
|
|
|
2,350 |
195 |
2,545 |
|
|
|
|
|
|
|
|
|
|
|
|
|
|
GRAND TOTAL STUDENTS |
|
|
|
188,000 |
9,400 |
197,400 |
GRAND TOTAL SCHOOLS |
|
|
|
4,800 |
410 |
5,210 |
Assessment Types
The assessment spiral types are shown in Table 2. There are two spirals at both grade 4 and grade 8. Session IDs contain six characters, traditionally. The first two characters identify the assessment “type” (subjects and type of spiral in a general way). Grade is contained in the second pair of characters, and the session sequential number (within schools) in the last two characters. For example, session DS0401 denotes the first grade 4 reading and mathematics operational DBA assessment in a given school.
Table 2. NAEP 2021 assessment types and IDs
ID |
Type |
Subjects |
Grades |
Schools |
Comments |
DS |
Operational |
Reading, mathematics |
4, 8 |
Public, Private |
Schools in the sigma (except Puerto Rico) and delta samples. |
DP |
Operational |
Mathematics |
4, 8 |
Public |
Puerto Rico sigma samples. |
Sample Types and Sizes
In somewhat similar fashion to past years, we identified two different types of school samples: sigma and delta. These distinguish sets of schools that will be conducting distinct portions of the assessment.
Sigma Samples at Grades 4 and 8
These are public school samples for grades 4 and 8. They will be used for the operational state-by- state assessments in reading and mathematics, and contribute to the national samples for these subjects as well. There are sigma samples for each state, DC, DoDEA, BIE, and Puerto Rico.
The details of the target student sample sizes for the sigma samples are as follows:
At each grade, the assessed student target sample size is 1,750 per state. The goal in each state is to roughly assess 875 students for math and 875 students for reading. The target sample size after considering attrition is 2,050 for grade 4 and 2,100 for grade 8. The DS session type will be used.
In Puerto Rico, the target sample size is 3,600 per grade (grades 4 and 8), with the goal of assessing 3,000 students in mathematics only, with the DP session type.
As in past state-by-state assessments, schools with fewer than 20 students in the grade in question were sampled at a moderately lower rate than other schools (at least half, and often higher, depending upon the size of the school). This is in implicit recognition of the greater cost and burden associated with surveying these schools.
Table 3 shows the target student sample sizes, and the approximate counts of schools to be selected in the sigma samples, along with the school and student frame counts, by state for grades 4 and 8.
The table also identifies the jurisdictions where we take all schools and where we take all students.
Table 3. Total sample sizes, by state
Jurisdiction |
Grade 4 |
Grade 8 |
||||||||
Schools in frame |
Schools in sample |
Students in frame |
Overall target student sample size |
|
Schools in frame |
Schools in sample |
Students in frame |
Overall target student sample size |
|
|
Alabama |
691 |
43 |
56,826 |
2,050 |
|
441 |
43 |
54,908 |
2,100 |
|
Alaska |
352 |
67 |
9,372 |
2,050 |
|
272 |
63 |
9,132 |
2,100 |
|
Arizona |
1,226 |
44 |
86,545 |
2,050 |
|
820 |
45 |
86,796 |
2,100 |
|
Arkansas |
473 |
43 |
37,321 |
2,050 |
|
308 |
44 |
36,694 |
2,100 |
|
Bureau Of Indian Education |
136 |
5 |
3,499 |
138 |
|
111 |
5 |
3,170 |
138 |
|
California |
6,127 |
43 |
458,116 |
2,050 |
|
3,086 |
44 |
468,753 |
2,100 |
|
Colorado |
1,103 |
45 |
67,137 |
2,050 |
|
609 |
45 |
68,254 |
2,100 |
|
Connecticut |
565 |
43 |
37,377 |
2,050 |
|
293 |
43 |
39,596 |
2,100 |
|
Delaware |
120 |
42 |
10,496 |
2,050 |
|
68 |
39 |
10,938 |
2,100 |
|
District Of Columbia |
128 |
47 |
6,441 |
2,050 |
|
78 |
42 |
5,458 |
2,100 |
|
DoDEA (Americas) Schools |
32 |
32 |
1,850 |
1,850 |
** |
15 |
15 |
1,221 |
1,221 |
** |
Florida |
2,273 |
42 |
216,694 |
2,050 |
|
1,281 |
44 |
215,429 |
2,100 |
|
Georgia |
1,252 |
41 |
132,406 |
2,050 |
|
579 |
42 |
135,430 |
2,100 |
|
Hawaii |
208 |
44 |
14,541 |
2,050 |
|
83 |
39 |
13,801 |
2,100 |
|
Idaho |
389 |
46 |
23,828 |
2,050 |
|
214 |
46 |
24,418 |
2,100 |
|
Illinois |
2,214 |
45 |
142,032 |
2,050 |
|
1,585 |
46 |
148,905 |
2,100 |
|
Indiana |
1,039 |
43 |
78,562 |
2,050 |
|
485 |
43 |
79,544 |
2,100 |
|
Iowa |
620 |
46 |
36,777 |
2,050 |
|
360 |
44 |
37,813 |
2,100 |
|
Kansas |
698 |
48 |
36,425 |
2,050 |
|
395 |
47 |
36,977 |
2,100 |
|
Kentucky |
718 |
43 |
50,079 |
2,050 |
|
416 |
45 |
51,056 |
2,100 |
|
Louisiana |
751 |
44 |
54,491 |
2,050 |
|
505 |
44 |
53,001 |
2,100 |
|
Maine |
310 |
55 |
13,131 |
2,050 |
|
200 |
49 |
13,542 |
2,100 |
|
Maryland |
894 |
43 |
68,759 |
2,050 |
|
376 |
43 |
66,083 |
2,100 |
|
Massachusetts |
957 |
43 |
69,662 |
2,050 |
|
492 |
43 |
71,983 |
2,100 |
|
Michigan |
1,677 |
45 |
105,409 |
2,050 |
|
1,098 |
45 |
112,015 |
2,100 |
|
Minnesota |
973 |
45 |
65,588 |
2,050 |
|
711 |
47 |
66,984 |
2,100 |
|
Mississippi |
412 |
43 |
37,114 |
2,050 |
|
277 |
43 |
35,806 |
2,100 |
|
Missouri |
1,177 |
47 |
68,717 |
2,050 |
|
706 |
47 |
69,209 |
2,100 |
|
Montana |
396 |
64 |
11,723 |
2,050 |
|
274 |
58 |
11,652 |
2,100 |
|
Table 3. Total sample sizes, by state (Continued)
Jurisdiction |
Grade 4 |
Grade 8 |
||||||||
Schools in frame |
Schools in sample |
Students in frame |
Overall target student sample size |
|
Schools in frame |
Schools in sample |
Students in frame |
Overall target student sample size |
|
|
Nebraska |
514 |
51 |
23,915 |
2,050 |
|
293 |
50 |
23,281 |
2,100 |
|
Nevada |
427 |
43 |
37,323 |
2,050 |
|
182 |
44 |
37,220 |
2,100 |
|
New Hampshire |
268 |
50 |
13,003 |
2,050 |
|
147 |
45 |
13,660 |
2,100 |
|
New Jersey |
1,368 |
44 |
97,312 |
2,050 |
|
796 |
44 |
99,712 |
2,100 |
|
New Mexico |
438 |
46 |
25,324 |
2,050 |
|
233 |
46 |
25,200 |
2,100 |
|
New York |
2,511 |
43 |
197,337 |
2,050 |
|
1,537 |
43 |
196,875 |
2,100 |
|
North Carolina |
1,500 |
43 |
119,306 |
2,050 |
|
775 |
43 |
119,589 |
2,100 |
|
North Dakota |
267 |
61 |
9,043 |
2,050 |
|
182 |
52 |
8,666 |
2,100 |
|
Ohio |
1,689 |
44 |
126,278 |
2,050 |
|
1,062 |
44 |
129,140 |
2,100 |
|
Oklahoma |
865 |
47 |
51,972 |
2,050 |
|
587 |
48 |
49,873 |
2,100 |
|
Oregon |
751 |
46 |
44,239 |
2,050 |
|
422 |
46 |
44,607 |
2,100 |
|
Pennsylvania |
1,546 |
42 |
128,810 |
2,050 |
|
886 |
43 |
132,393 |
2,100 |
|
Puerto Rico |
531 |
149 |
20,203 |
3,600 |
|
345 |
145 |
22,853 |
3,600 |
|
Rhode Island |
165 |
44 |
10,465 |
2,050 |
|
62 |
41 |
10,848 |
2,100 |
|
South Carolina |
658 |
42 |
59,222 |
2,050 |
|
317 |
42 |
58,031 |
2,100 |
|
South Dakota |
312 |
61 |
10,801 |
2,050 |
|
251 |
58 |
10,732 |
2,100 |
|
Tennessee |
1,005 |
43 |
75,932 |
2,050 |
|
602 |
44 |
75,788 |
2,100 |
|
Texas |
4,601 |
43 |
401,605 |
2,050 |
|
2,337 |
44 |
406,630 |
2,100 |
|
Utah |
659 |
43 |
51,456 |
2,050 |
|
278 |
43 |
51,999 |
2,100 |
|
Vermont |
211 |
69 |
6,015 |
2,050 |
|
118 |
53 |
5,900 |
2,100 |
|
Virginia |
1,107 |
42 |
96,559 |
2,050 |
|
381 |
42 |
98,204 |
2,100 |
|
Washington |
1,237 |
44 |
84,578 |
2,050 |
|
622 |
45 |
83,159 |
2,100 |
|
West Virginia |
394 |
50 |
19,520 |
2,050 |
|
184 |
44 |
19,768 |
2,100 |
|
Wisconsin |
1,081 |
47 |
60,115 |
2,050 |
|
647 |
45 |
61,629 |
2,100 |
|
Wyoming |
189 |
53 |
7,376 |
2,050 |
|
95 |
39 |
7,549 |
2,100 |
|
Total |
52,205 |
2,571 |
3,778,627 |
110,138 |
|
29,479 |
2,472 |
3,821,874 |
112,059 |
|
** identifies jurisdictions where all students for the given grade are included in the NAEP sample.
Stratification
Each state and grade was stratified separately, but using a common approach in all cases. TUDA districts were separated from the balance of their state, and each part stratified separately. This is because at the time of carrying out the stratification, TUDA assessments remained part of the program. The first level of stratification was based on urban-centric type of location. This variable has 12 levels (some of which may not be present in a given state or TUDA district), and these were collapsed so that each of the resulting location categories contained at least 15 percent of the student population (20 percent for TUDA districts).
Within each of the resulting location categories, schools were assigned a minority enrollment status. This was based on the two race/ethnic groups that were the second and third most prevalent within the location category. If these groups were both low in percentage terms, no minority classification was used. Otherwise three (or occasionally four) equal-sized groups (generally high, medium, and low minority) were formed based on the distribution across schools of the two minority groups.
Within the resulting location and minority group classes (of which there are likely to be from three to fifteen, depending upon the jurisdiction), schools were sorted by a measure derived from school level results from the most recent available state achievement tests at the relevant grade. In general, mathematics test results were used, but where these were not available, reading results were used. In the few states that do not have math or reading tests at grades 4 and 8 (or where we are unable to match the results to the NAEP school frame), instead of achievement data, schools were sorted using a measure of socio-economic status. This is the median household income of the 5-digit ZIP Code area where the school is located, based on the 2018 ACS (5-year) data. For BIE and DoDEA schools neither achievement data nor income data are available, and so grade enrollment was used in these cases.
Once the schools were sorted by location class, minority enrollment class, and achievement data (or household income), a systematic sample of schools was selected using a random start. Schools were sampled with probability proportional to size. The exact details of this process are described in the individual sampling specification memos.
Delta Samples
These are the private school samples at grades 4 and 8 for conducting the operational assessments in reading and mathematics. The sample sizes are large enough to report results by Catholic and non- Catholic at grades 4 and 8. Approximately half the sample at each grade is from Catholic schools.
The number of students targeted per school is 50 at each grade.
Stratification
The private schools were explicitly stratified by private school type (Catholic/Other). Within each private school type, stratification was by Census region (4 categories), type of location (12 categories), race/ethnicity composition, and enrollment size. In general, where there were few or no schools in a given stratum, categories were collapsed together, always preserving the private school type.
New Schools
To compensate for the fact that files used to create the NAEP school sampling frames are at least two years out of date at the time of frame construction, we supplemented the sigma and delta samples with new school samples at each grade.
The new school samples were drawn using a two-stage design. At the first stage, a minimum of ten school districts (in states with at least ten districts) were selected from each state for public schools, and ten Catholic dioceses were selected nationally for the private schools. The sampled districts and dioceses were asked to review lists of their respective schools and identify new schools. Frames of new schools were constructed from these updates, and new schools were drawn with probability proportional to size using the same sample rates as their corresponding original school samples.
The school sample sizes in the above tables do not reflect new school samples.
Substitute Samples
A substitute sample was selected for the delta sample. The substitute school for each original was the next “available” school on the sorted sampling frame, with the following exceptions:
Schools selected for any NAEP samples are not used as substitutes.
Private schools whose school affiliation is unknown are not used as substitutes. Also, unknown affiliated private schools in the original samples do not get substitutes.
A school can be a substitute for one and only one sample. (If a school is selected as a substitute school for grade 8, for example, it cannot be used as a substitute for grade 4.)
A Catholic school substitute is always a Catholic school, and the same for non-Catholic schools.
Student Sampling
Students within the sampled schools will be selected with equal probability. The student sampling parameters vary by sample type (sigma and delta) and grade, as described below.
Sigma Sample, Grades 4 and 8 Schools (Except Puerto Rico)
All students, up to 52, will be selected.
If the school has more than 52 students, a systematic sample of 50 students will be selected. In some schools, the school may be assigned more than one ‘hit’ in sampling. In these schools we will select a sample of size 50 times the number of hits, taking all students if this target is greater than or equal to 50/52 of the total enrollment.
Sigma Sample, Puerto Rico Grades 4 and 8
All students, up to 26, will be selected.
If the school has more than 26 students, a systematic sample of 25 students will be selected.
Delta Samples, Grades 4 and 8
All students, up to 52, will be selected.
If the school has more than 52 students, a systematic sample of 50 students will be selected.
Weighting Requirements
The Operational Reading and Mathematics Assessments, Grades 4 and 8
The sample will have weights for each subject (reading and math) applied to reflect probabilities of selection, school and student nonresponse, any trimming, and the random assignment to the particular subject. There will be separate replication schemes by grade and public/private. Weights will also be derived for the Puerto Rico assessment at grades 4 and 8.
| File Type | application/vnd.openxmlformats-officedocument.wordprocessingml.document |
| File Title | Appendix A (Statute Authorizing NAEP) |
| Author | joconnell |
| File Modified | 0000-00-00 |
| File Created | 2021-04-28 |
© 2025 OMB.report | Privacy Policy